- Summary:
- The BT share price bullish comeback has faded. We explain why this has happened and why a break and retest pattern will likely form.
The BT share price has moved sideways in the past few days. The stock is trading at 166p, which is close to its highest level since September 7. The shares have jumped by more than 23% from the lowest level in October. Still, it is about 20% below its highest level this year.
BT recovery rally fades
BT Group is a giant telecommunication and media company in the UK. Previously, the company was a government-owned entity until it was privatised in 1984.
BT shares have been making a bullish rebound in the past few weeks. This happened as speculation rose that Patrick Drahi, the company’s biggest shareholder was considering a takeover bid.
According to Reuters, the billionaire has been adding to his 12% stake in the firm. As a result, the company’s board has been building its defenses against a bid.
This is notable since Drahi has until December to make his ambitions known. Some analysts believe that he will seek to acquire BT and add it into his Altice business. Others believe that he will adopt a more activist role and seek the company to improve its operations.
Still, fundamentally, BT faces an uphill task ahead. For one, it is facing significant competition from some of the best-known companies in the UK including TalkTalk and Vodafone.
BT share price forecast
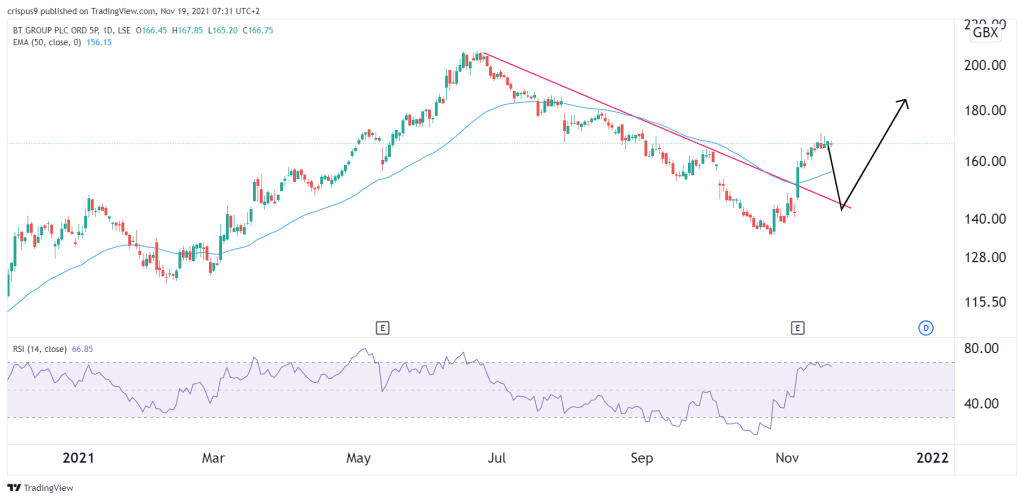
On the daily chart, we see that the BT share price has been in a major bullish trend in the past few weeks. The stock has risen by more than 20% as investors remain optimistic about the company. Along the way, the stock has risen above the descending trendline that is shown in pink. This is a bullish sign. It has also risen above the 25-day and 50-day moving averages
Therefore, while the rally has paused, there is a likelihood that it will go on in the coming weeks. Another scenario is where the stock retests the descending trendline by falling by about 10% and then resume the bullish trend.


