- Summary:
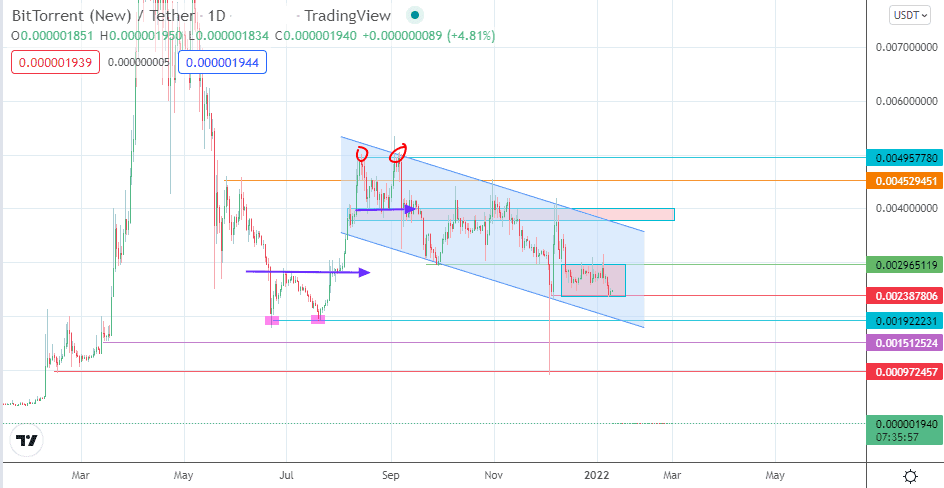
- The BitTorrent price prediction is for the rectangle on the daily chart to decide the price moves of the next 2-3 weeks.
The hefty fall of the BTT/USDT pair in 2021 and subsequent mild recovery, truncated by the 15 August/5 September 2021 double top, put this pair in a precarious position even before the major crypto market correction that started in November 2021.
Recent price action has seen the pair trading in a tight horizontal range. However, the BitTorrent price prediction indicates the potential for range-trade remains higher than for a further slide or a recovery at this time.
However, the sideways price move is still within the context of a gradual correction from the upswing that resulted from the completion of the 21 June/20 July double bottom. This correction, contained within the descending channel, is yet to show signs of resolution. However, this could all change if the immediate rectangle pattern formed by the recent price action resolves.
BitTorrent Price Prediction
The rectangle pattern is formed by recent range-bound price activity and has 0.00239 as its floor and 0.00297 as its ceiling. The price activity is currently challenging support, where a breakdown will open the door towards 0.00192. Below this level, 0.00151 and 0.00097 form additional downside targets available on continued price deterioration.
On the flip side, the bulls need to initiate a bounce off the current support, taking out the ceiling at 0.00297 for a price recovery towards the 0.00377/0.00401 resistance zone. Above this resistance zone, 0.00496 lies in wait as the upside target that must be broken for the uptrend to be restored.
BTT/USDT: Daily Chart

Follow Eno on Twitter.


