- Bitcoin price has been struggling in August, and its recent trends suggest that the selling pressure could be too strong in the coming days.
Bitcoin price slipped below the psychological $60k level on Thursday, underlining a market paralysis that could trigger either a massive rally to the upside or a sharp decline. BTC traded at $58,745 at the time of writing, a sharp decline from Wednesday’s session that had seen it rise to near the $62k mark. Such is the volatility that has defined the crypto bellwether for the most part in August, making it a disincentive to hodlers and less attractive for buyers. The digital currency is 4.9 percent in the red in August.
Notably, Bitcoin has traded within tight margins of +/- 3.7 percent for the last six days. Therefore, a breakout could be around the corner. This time around, the 60k mark seems to be the inflection point. Therefore, we are unlikely to see significant upside or downside momentum if it stays within $5k range either side of the mark.
In recent days, there has been little action by BTC as far as market fundamentals go, which calls for greater attention to the technicals. Speaking of which, the 20-SMA has recently crossed below both the 50 SMA and 200 SMA on the daily chart. Furthermore, the 200-SMA is above the other two Simple Moving Averages, and the current price is below all three SMAs.

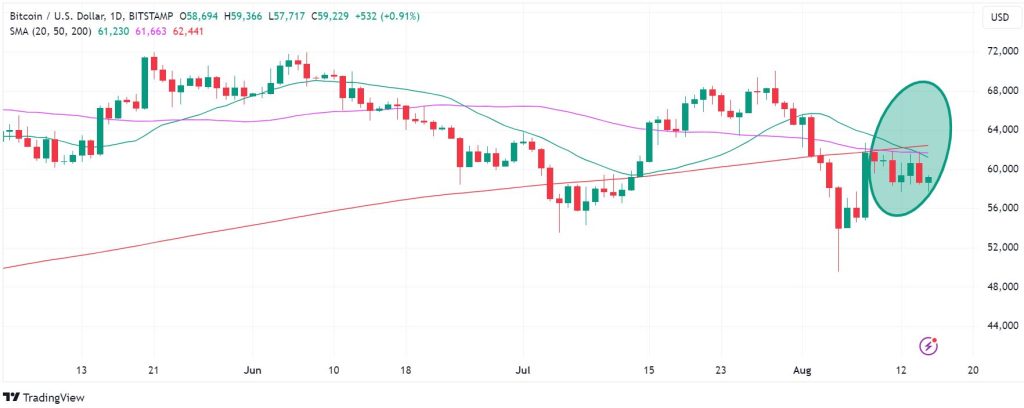
BTCUSD daily chart
This trend is also replicated on the 4-hour chart, where, in addition to the SMAs, the Relative Strength Index (RSI) is below 50. Therefore, barring significant changes in the market fundamentals, the BTC price trend currently has the hallmarks of an impending breakout to the south.
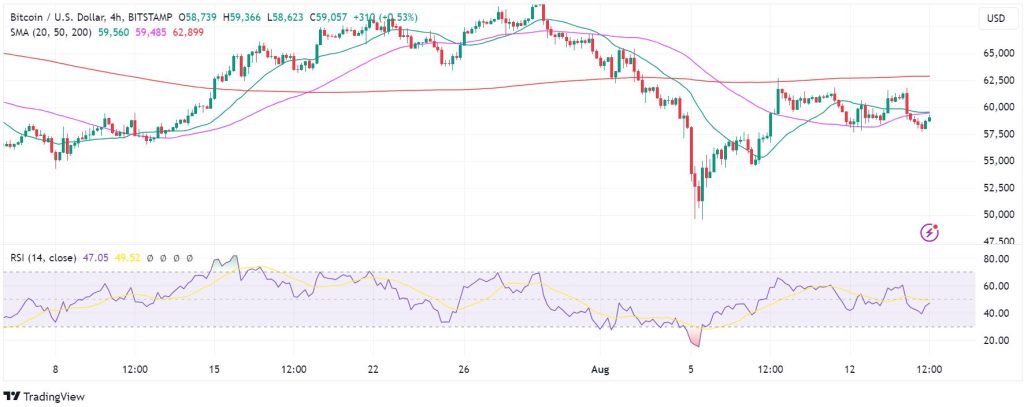
BTCUSD 4-hour chart
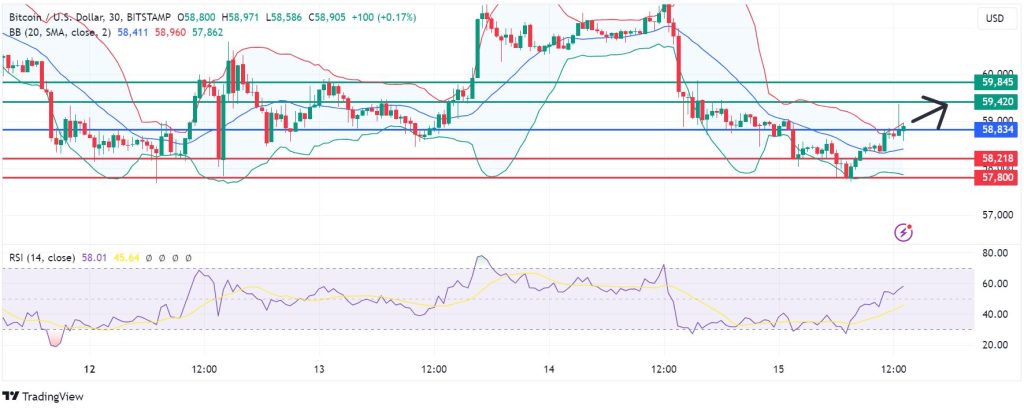
Support and resistance levels
The momentum on the 30-minute Bitcoin price chart suggests control by the buyers above the 58,845 pivot mark. Look for the first resistance at 59,420 mark, but if the buyers extend their control, they could break above that level to test 59,845. Conversely, a move below 58,834 will favour the sellers to take control. In that case, the first support could come at 58,218. However, if the sellers extend their control, they could go below that level and build the momentum to invalidate the upside narrative and potentially test 57,800.