- Summary:
- In this Bitcoin price prediction, we explain why the coin’s price has declined sharply and why its Nasdaq 100 correlation is intensifying.
Bitcoin price is stuck in a range as investors continue focusing on the ongoing change of tone by the Federal Reserve. The BTC price is trading at $40,687, slightly below Thursday’s high of $43,000. Other cryptocurrencies like Ethereum, XRP, and Avalanche are also in a narrow range, while the fear and greed index is in the fear zone.
Nasdaq 100 and Bitcoin correlation
The BTC price performance mirrors that of the Nasdaq 100 index. The tech-heavy index slumped by more than 278 points on Thursday as concerns about Netflix and other high-growth companies remained. Netflix stock has crashed by almost 40% in the past two days as investors digest the weak earnings by the company. In addition, the firm said that it lost customers for the first time in a decade.
In most cases, Bitcoin price tends to decline when Nasdaq 100 rises and vice versa. The two also declined after Jerome Powell sounded a bit hawkish in IMF meetings. He said that the bank would likely move forward with a 0.50% rate hike in its upcoming meeting. Also, he noted that quantitative tightening (QT) would likely happen.
These factors explain why the fear and greed index is still at the fear level. The one tracked by CNN Money has dropped to 39, while the Bitcoin fear and greed index is at26. Another reason why Bitcoin price is struggling is that Binance moved to limit its services in Russia. The company will limit its services to all Russians with assets worth over 10,000 euros. It will also not accept any deposits on these accounts.
Bitcoin price prediction
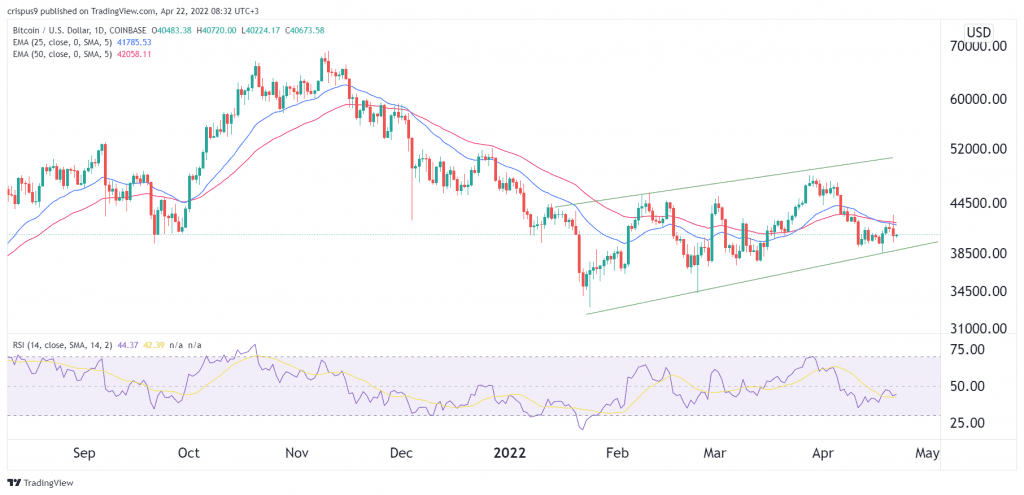
The daily chart shows that the BTC price has struggled in the past few days. It is trading at the support level of $40,000, slightly above this week’s low of $38,700. The coin has also formed an ascending channel pattern shown in green. However, a closer look reveals that it has also formed what looks like a bearish flag pattern.
Therefore, the coin will likely have a bearish breakout in the coming days because of this flag pattern. This view will be confirmed if it moves below the lower line of the ascending channel pattern.


