- Bitcoin surges toward $92,000 as excitement over Spot ETF approval builds. Could this be the final push toward the coveted $100K milestone?
Bitcoin continues its remarkable rally, crossing the psychological $90,000 mark and cementing its position as the market’s focal point. BTC’s bullish momentum shows no signs of slowing down, so what next?
Bitcoin Price Latest Updates
- ETF Approval Buzz: Recent reports suggest growing anticipation for a Bitcoin Spot ETF approval in the coming weeks. Institutional players are eyeing this development, which could inject significant capital into the crypto market.
- Whale Engagement at Record Levels: On-chain statistics reveal that Bitcoin whales have been accumulating notably, with wallets containing more than 10,000 BTC hitting a 3-year peak.
- Worldwide Bitcoin Mining Surge and Retail Investors increased activity.
Bitcoin Price Chart Analysis
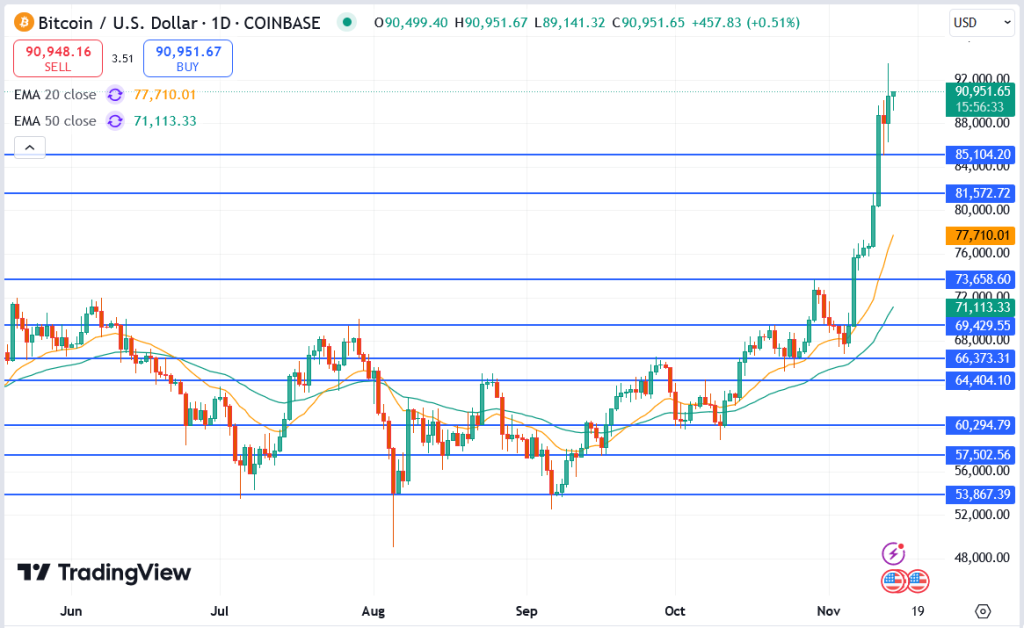
Bitcoin is now trading at $90,951, marking a 0.51% gain. The following key levels are evident on the daily chart:
Bitcoin Support Levels
- $85,104: A crucial support level from the recent consolidation zone.
- $81,572: The next safety net, aligned with Bitcoin’s previous breakout point.
Bitcoin Resistance Levels
- $92,000: The immediate resistance, which Bitcoin needs to clear to sustain its rally.
- $95,000: A psychological milestone that could trigger profit-taking by short-term traders.
Exponential Moving Averages (EMAs)
- 20-Day EMA: Currently at $77,710, this level underscores the strength of the uptrend, with BTC consistently trading well above it.
- 50-Day EMA: At $71,113, this serves as a long-term trend indicator, solidifying the bullish momentum.
Fibonacci Retracement Analysis
Using the Fibonacci retracement tool from Bitcoin’s June lows of $48,000 to its recent high of $90,951:
- 38.2% Level: Found at $73,000, this is the key retracement zone if BTC faces a short-term correction.
- 50% Level: At $69,500, aligning closely with the 50-Day EMA.

What to Watch Next?
Bitcoin’s surge occurs alongside a wider rebound in the cryptocurrency market, yet traders need to stay aware of outside influences. The forthcoming Federal Reserve minutes and news on ETF endorsements will probably determine BTC’s next direction. A distinct move above $92,000 could open the path towards $100,000, whereas any retreat might encounter support around the $85,000 mark.
Conclusion
Bitcoin’s surge to $90,000 has everyone excited, but the key question is: will it continue to rise, or will the market pause for a break? The enthusiasm is tangibly high with traders focused on the $92,000 mark and murmurs of $100,000 circulating. Whether you’re a holder or simply here for entertainment, the upcoming days guarantee a lot of activity.


