- With the Bitcoin price down over 30% from the ATH and PlanB's S2F model on the scrapheap, BTC longs are paying the price.
With the Bitcoin price down over 30% from the ATH and PlanB’s S2F model on the scrapheap, BTC longs are paying the price.
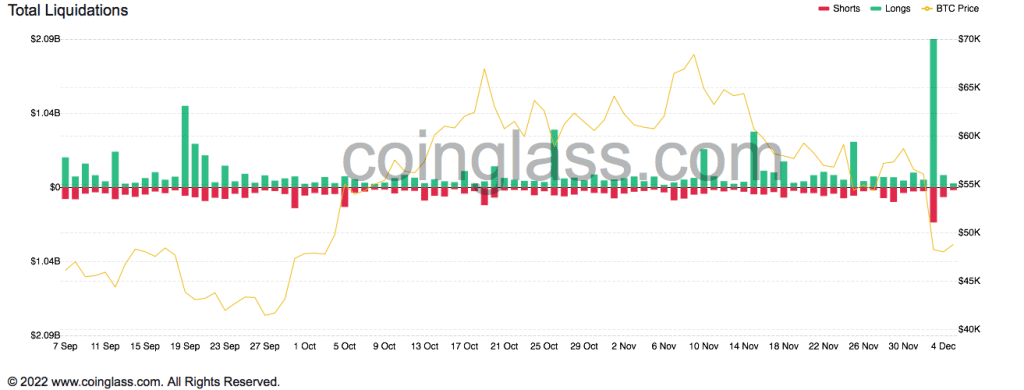
Almost $2 billion leveraged longs were wiped out on Saturday when Bitcoin collapsed 20% after breaking down below several significant support levels. Although Bitcoin was weak from the start in early-Asian trading on Saturday, the real damage came when BTC broke below trend support at $51,500, and within 25 minutes, was changing hands almost $10,000 lower at $42,000. Remarkably, the price bounced from the lows, and on Sunday was knocking on the door of $50k. However, in my opinion, the rebound is the knee-jerk reaction of an oversold market and not the start of a sustained recovery.
Bulls Slaughtered as Leveraged trades blow up

Stock-to-Flow Model breaks down
One of the reasons so many traders were over-exposed is they were blindly following uber-bullish Bitcoin price prediction models like PlanB’s S2F. The model, which uses supply scarcity due to halvings to forecast future prices, suggested that BTC would reach $135k in December. However, PlanB missed November’s $98k call by more than $40,000, exposing flaws in the one-dimensional model. Furthermore, several popular Bitcoin influencers have been far off the mark, leaving many followers lacking a narrative.
BTC Price Analysis
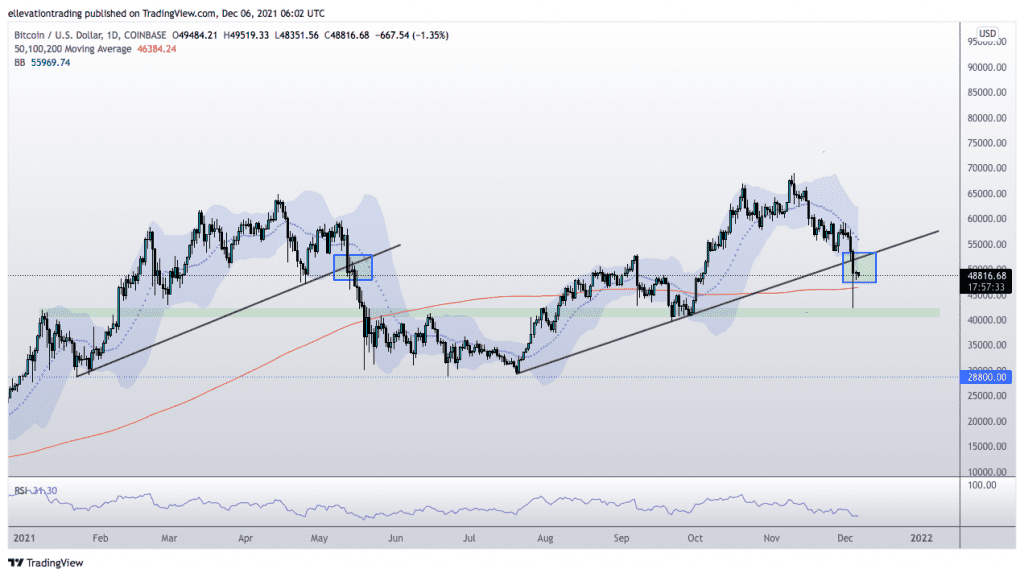
The daily chart shows that the Bitcoin price bounced from a solid support band between $40-$42k. However, the price action is incredibly similar to May, when BTC broke the trend line support after reaching a new all-time high. In that instance, BTC dropped 40% to $30k before a material bounce. Coincidentally, the sell-off in May started at almost the same price as Saturday’s meltdown ($50,600).
I expect the selling will continue as more traders realize the bull market narrative has broken down on many levels. An obvious catalyst will be if BTC closes below the 200-Day Moving Average at $46,381. A retest of Saturday’s $42k low should follow in that event. Furthermore, if Bitcoin breaks down below $42k, we could see a similar size move to May, which brings the $30k level into view.
Can the Bitcoin Price Recover?
For Bitcoin to recover, it needs to recapture the trend support (now resistance) at $52,000. On the plus side, the market is not as heavy following the substantial liquidations. Furthermore, the Fear and Greed Index shows extreme fear. However, I think the ‘extreme’ fear may soon lead to ‘extreme’ panic, forcing another round of liquidations.
On that basis, I am still bearish with a price target of $30k. However, a daily close above $52,000 will suggest the bulls have turned things around and invalidate the pessimistic view.
Bitcoin Price Chart (daily)

For more market insights, follow Elliott on Twitter.


