- Summary:
- The Bitcoin price is finally back on track and potentially building traction for an upside extension to a new all-time high.
The Bitcoin price is finally back on track and potentially building traction for an upside extension to a new all-time high. Bitcoin (BTC) is trading at $64,000 (+1.10), up around 4% so far this month and +125% year-to-date. Bitcoin’s market cap has swollen to $1.25 Trillion, and its dominance increased to 43.2%.
For the last two weeks, BTC has fluctuated on either side of $62k, until this morning that is. The Bitcoin price has bounced several times from below $60k this month, only to return back to the psychological support level. However, this morning, BTC is pulling clear from danger and appears to be breaking higher.
The obvious catalyst is the launch of the BetaShares ‘crypto company’ Exchange Traded Fund in Australia this morning. The ETF allows investors exposure to 50 crypto-related companies, including Coinbase (COIN) and Galaxy Digital. Today’s listing attracted massive investor interest, smashing the existing first-day record for an ETF within 15-minutes of trading. As a result, a wave of optimism is washing over the crypto market as traders try to push the Bitcoin price to a new record of its own.
BTC Price Forecast
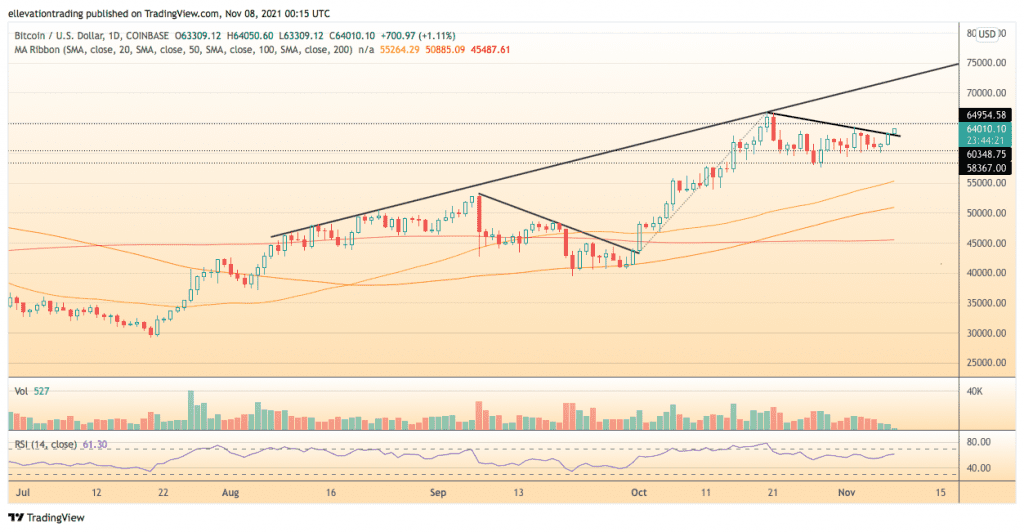
The daily chart shows that BTC is trading at its highest point so far this month. Subsequently, BTC is breaking above trendline resistance. And because of the recent sideways action, the Relative Strength Index (RSI) reads just 63, suggesting the impulse higher could have more room to run.
And as long the breakout holds, I expect BTC to print a new high sometime in the next day or two. Furthermore, if BTC clears the former ATH at $66,999, a logical target is the rising trendline resistance from August at $72,000.
However, if the BTC price returns below the descending trendline line at $62,700 it will indicate a false breakout and invalidate the bullish thesis.
Bitcoin Price Chart (Daily)

For more market insights, follow Elliott on Twitter.


