- Summary:
- XRP price declined by more than 10 percent on Monday, expressing the wider crypto market sentiment. How low can it go?
XRP price extended its losing streak to six consecutive sessions on Monday, as it plummeted by 12.7 percent on the daily chart to trade at $0.456. The move saw it breach the psychological $0.500 support mark, putting it on the cusp of sustained downside momentum. The crypto asset has lost 23.6 percent of its value in the last week, underlining a strong selling momentum. Moreover, the much-hyped meeting between Ripple lawyers and the Securities and Exchange Commission (SEC) did not live up to the expected settlement, which had been partly responsible for XRP’s recent gains.
Why is XRP price nosediving?
However, the latest loss by XRP is not a unique expression of its weak fundamentals, but a reflection of the general bearish sentiment in asset markets following fears over potential US economic contraction. Crypto market bellwether, Bitcoin, momentarily slipped below $50k for the first time since February, sending a warning signal across the market. BTCUSD has lost about a quarter of its value in the last seven days, pulling the rest of the markets down with it.
Also, the cryptocurrency market capitalisation has fallen from $2.4 trillion to $1.84 trillion during that period. Under these circumstances, it is difficult to see a way back up for XRP, barring a positive development around its case versus the SEC. Meanwhile, CoinMarketCap reports a 273 percent spike in XRP’s trading volume worth 3.9 billion in the last 24 hours. That could exacerbate the price decline under the current market conditions.
Momentum indicators
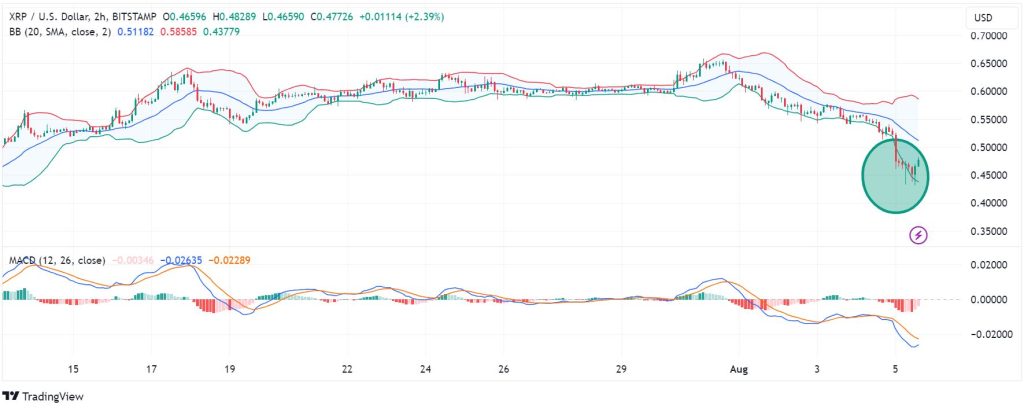
On the 2-hour chart, XRP price has stayed below the middle Bollinger Band for a prolonged period. Notably, the market has resisted multiple attempts to trade below the lower band, which corresponds to the $0.437 mark. Therefore, this is a critical support level for the XRPUSD pair in the near term. Meanwhile, the Moving Average Convergence Divergence (MACD) indicator line is below the signal line, adding support to the downward momentum.
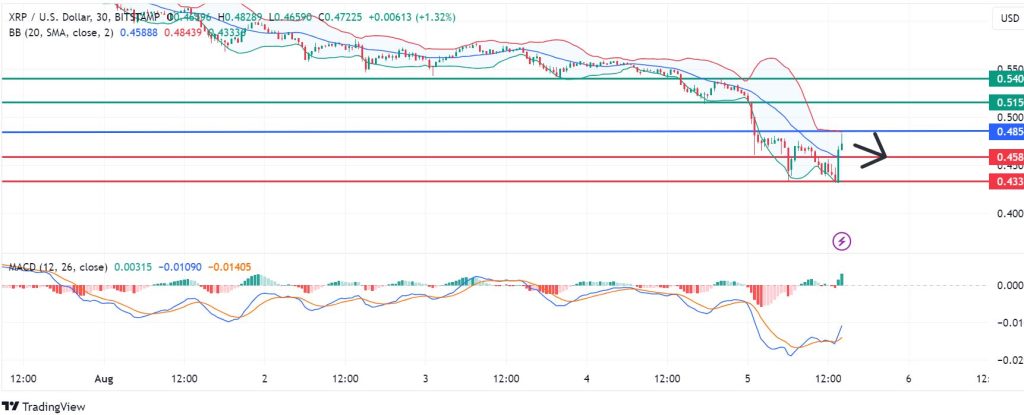
Support and resistance levels
The momentum on XRP price favours control by the sellers if resistance remains at the 0.485 pivot. That could see the first support established at 0.458, but extended control by the sellers could lead to a break below that mark and result in further decline to test 0.433. Alternatively, the buyers will have the upper hand if the price breaks above 0.485. In that case, the first resistance could be encountered at 0.515. However, a sustained upside momentum could break above that barrier and invalidate the downside narrative. Also, that could lead to further gains to test 0.540.