- Summary:
- The Barclays share price formed a bullish engulfing pattern as the American bank earnings season kicked off. What next for BARC stock?
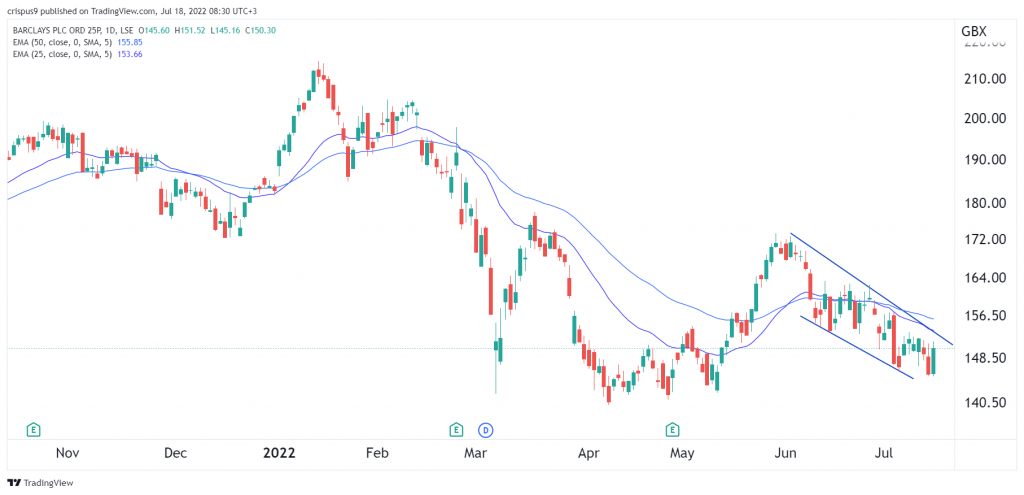
The Barclays share price formed a bullish engulfing pattern as the American bank earnings season kicked off. The stock rose to a high of 150p, which is about 3.66% above the lowest level last week. The price action was in line with that of other top banks like Lloyds, NatWest, and HSBC,
Bank earnings season
American banks kicked off their earnings season last week. JP Morgan, the biggest bank in the country, reported relatively weak results as it increased its provisions for bad credit. As a result, its earnings dipped by about 28%.
Similarly, Morgan Stanley reported weak earnings as investment banking revenue declined sharply. Its revenue of $13.13 billion was lower than the median estimate of $13.48 billion. Its profit dropped by about 29% to $2.9 billion.
Meanwhile, Bank of New York Mellon’s earnings per share of $1.03 was lower than the expected $1.12. In addition, its revenue of $4.3 billion was lower than the expected $4.13 billion. Citigroup was the only major bank to publish strong results.
The Barclays share price will react to the latest earnings by large American banks like Goldman Sachs and Bank of America. In addition, smaller regional banks like Park, Guaranty, and PNC will also publish their results this week. These results will provide an estimate of Barclay’s earnings when it reports on July 28th of this year.
Barclays share price forecast
The daily chart shows that the BARC share price has been in a strong bearish trend in the past few days. The stock formed a bullish engulfing pattern on Friday. In technical analysis, this is usually a bullish sign. It remains below the 25-day and 50-day moving averages, and the upper side of the descending channel is shown in blue.
Therefore, because of the bullish engulfing pattern, there is a likelihood that the stock will continue rising as bulls target the key resistance point at 155p. Of course, this price action will depend on this week’s earnings by large American banks.


