Barclays share price is attempting to join the bullish stock party in a market where banks have mostly been left behind. European stocks were higher again today, whilst the FTSE 100 tried to continue yesterday’s bullish move with a test of the 6,000 level.
European bank stocks are also seeing a shakeup in the Euro Stoxx 50 index with Société Générale and BBVA being removed, while Santander is the fall guy from the Stoxx Europe 50. Banks in the Eurozone have struggled with the ongoing drive into negative interest rates, alongside poor economic growth, which has soured the mood for government debt. The environment has increased the stress for the banks, which were working on building tier-1 capital ratios and now have to move back to large loan loss provisions.
Barclays stated in their latest earnings release for the first half of 2020 that the Tangible Net Asset Value (TNAV) of the company’s shares was 284p. The stock traded at 180p before the coronavirus panic selling and the bank now finds itself selling at a 40% discount to that price.
There is no doubt that Barclays has some value, but the market will be concerned about the economic fallout from the virus lockdowns, whilst the effects will also add some contagion risk due to the problems at other banks. First half revenues were positive for the company with £11.7bn of revenue, which was higher than the same period of 2019, despite the virus chaos this year. The company is likely to see a strong second half and if the economy can continue its rebound then the shares can see a rally higher. Another downside risk could be selling in the frothy U.S. tech stocks, which continue to pull other indices higher.
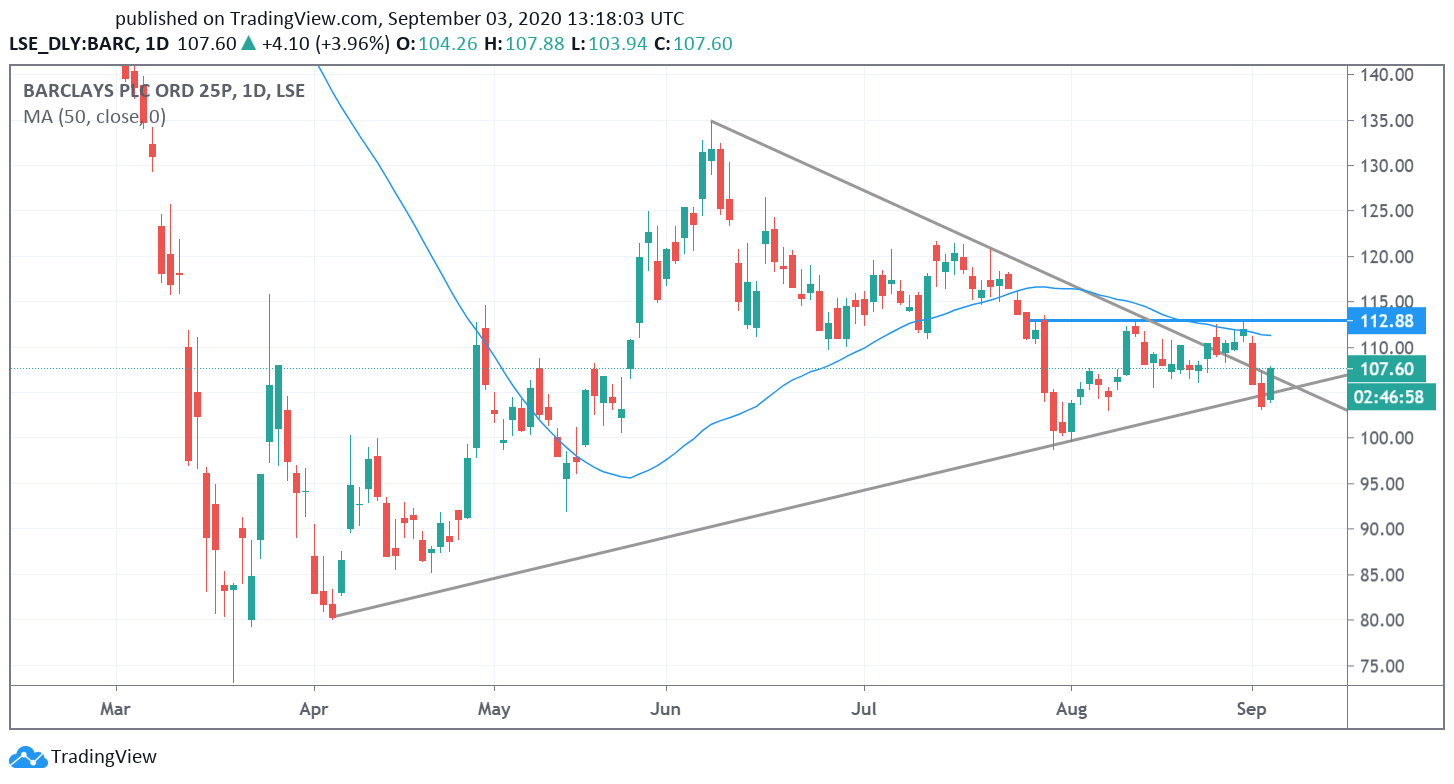
The move higher in Barclays share price is coming after a test of uptrend support from the July 30th low. The technical setup also shows another test of a symmetrical triangle consolidation from the March lows. Resistance for Barclays comes in at 112.88. The 118.00 and 120.00 levels would be possible if the market can push higher. A close below the triangle support line would be the time to cut long positions.