- Summary:
- What is the outlook of the Band Protocol price as it forms a cup and handle pattern? We explain whether to buy $BAND
Band Protocol crypto price continued its bullish trend on Tuesday as the bullish momentum gained steam. The token jumped to a high of $2.38, the highest level since December 3, making it one of the top-performing coins according to data by Binance. Like other cryptocurrencies, $BAND has surged by over 60% from its lowest point in 2022.
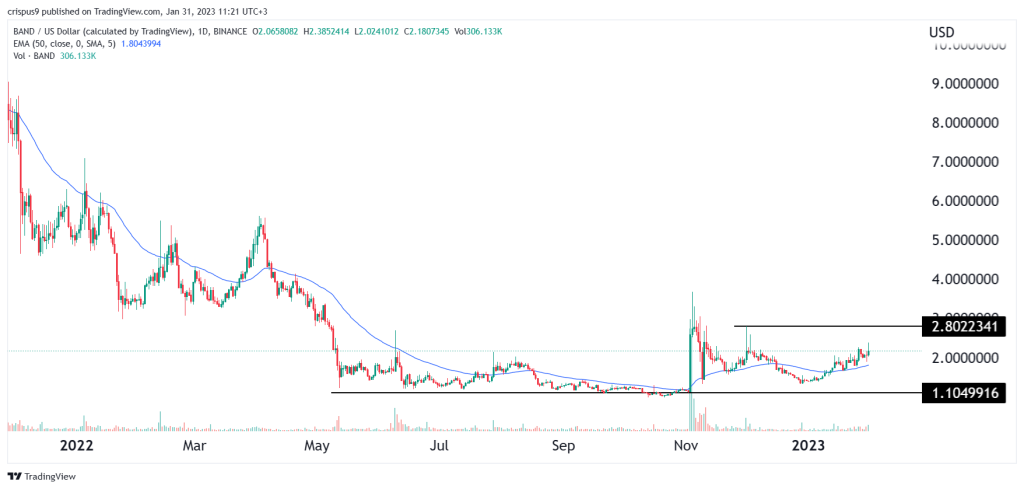
$BAND price analysis (daily chart)
Band Protocol price crashed hard in 2022 as demand for its products dropped. In 2022, the total value secured (TVS) plunged from over $6 billion to less than $500 million. This decline happened as the volume of DeFi transactions continued to fall in 2022. Now, the TVS has risen to almost $700 million. KyberSwap’s TVL has risen by 21% this year while Homora and CREAM Finance have risen by over 25%.
On the daily chart, we see that BAND price formed a strong support at $1.1050, where it failed to move below several times last year. It first tested that support in May 2022. Recently, it has jumped ahead of the upcoming Fed decision and moved above the 50-day moving average.
Now, buyers are targeting the important resistance level at $2.80, the highest point on December 1. Volume remains significantly low. Therefore, at this stage, it is hard to predict whether the bullish trend will continue in the near term. If this happens, the key level to watch will be at $2.80, which is about 27% above the current level. However, a move below the 50-day MA will invalidate the bullish view.

BAND protocol price prediction
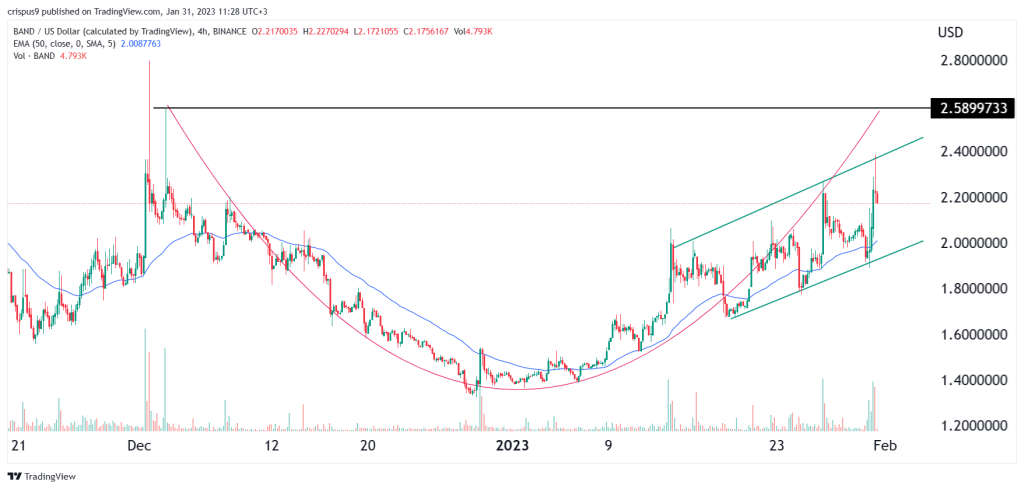
Turning to the 4H chart, we see that the Band Protocol price has formed an ascending channel shown in green. It retested the upper side of the channel on Tuesday and moved above the 50-period moving average. It also seems to be forming a cup and handle pattern that is shown in red. In most periods, the C&H pattern is usually a bullish sign.
Therefore, in the immediate short-time, the outlook for the $BAND price is bullish, with the next key level to watch being at $2.590.


