- Summary:
- The emergence of the falling wedge and the RSI divergence on the daily chart could boost bullish Audius price predictions.
The crypto market has had a modestly bullish start in March. For crypto tokens such as Audius, it has brought some hope for recovery and the potential for bullish Audius price predictions.
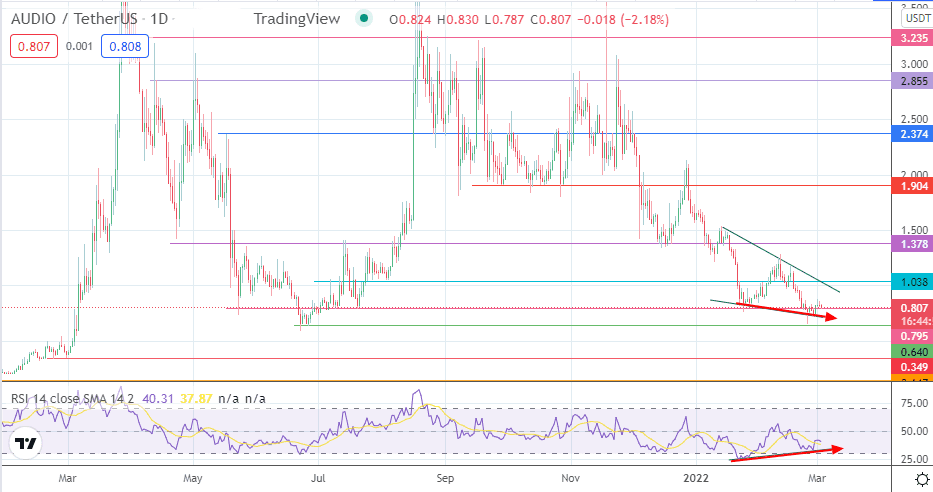
Boosting the chances of success of any bullish Audius price predictions is the situation on the daily chart. There is an evolving falling wedge pattern, backed up by a price divergence from the relative strength index (RSI). The picture has bullish ramifications if the market decides to play squarely on the technical picture and not on the prevailing sentiment or geopolitics.
In February, the Audius music app entrenched itself further in the Solana ecosystem after launching a wrapped version of its Ethereum-based AUDIO token. Users who hold the AUDIO ERC-20 token version can use the Wormhole Portal to move their tokens to the Solana blockchain. From a trading perspective, this move could initiate a correlation between Solana and Audius. However, this would need to be tested over time.
Audius Price Prediction
The Audius price prediction has a bullish tilt thanks to the evolving falling wedge pattern. The price is currently testing the 0.795 support. A bounce from here targets the wedge’s upper border at 1.038. If the price activity breaks out from here, 1.378 becomes an additional target to the north and the site of a potential completion of the measured move.
On the flip side, a breakdown of 0.795 threatens the wedge’s lower border. A breakdown at this point and the 0.640 support would invalidate the pattern. This scenario would leave the support at 0.349 vulnerable to an onslaught from the bears. The 1 January 2021 low at 0.147 would become the automatic downside target if the bears degrade the support at 0.349 (17 February and 1 March 2021 lows).
AUDIO/USDT: Daily Chart

Follow Eno on Twitter.


