- Summary:
- The Arweave Price has declined steadily over the last week and is down 20%. However, a failure to hold trend support could extend the losses.
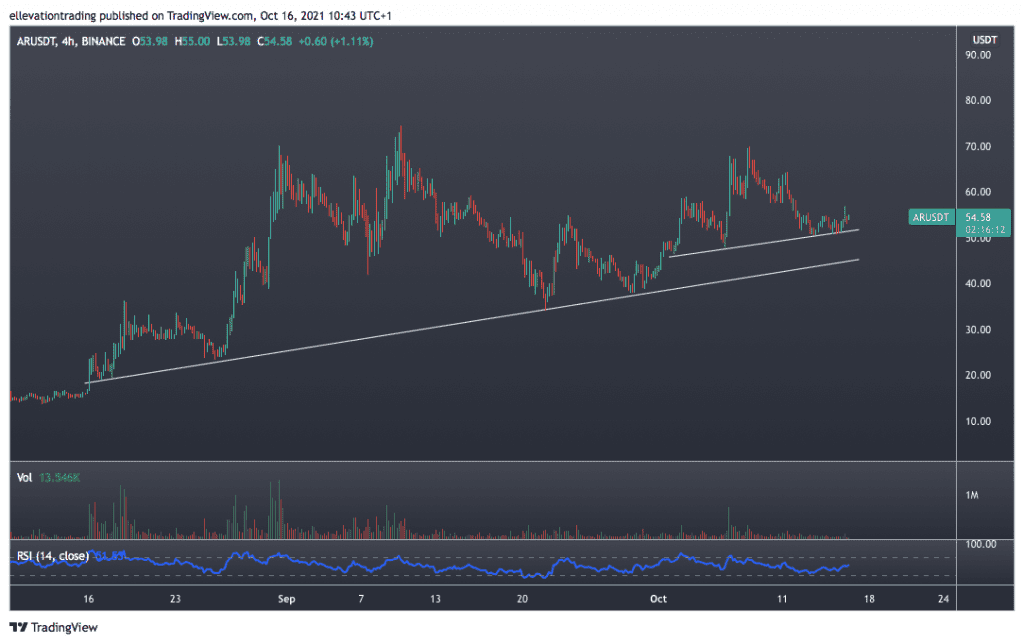
The Arweave Price has declined steadily over the last week and is down 20%. However, a failure to hold trend support could extend the losses. Even though Bitcoin is within a whisker of its all-time high, altcoins such as Arweave (AR) are having a tough time with it. The decentralised storage network has retreated from $69.8 on the 8th of October to $54.50 this morning.
The last three months have been a roller-coaster ride for Arweave traders. The Network’s native AR token surged over 1000%, from $7.30 in July to $74 in September. However, like most cryptocurrencies, Arweave suffered substantial losses in the second half of the same month as the market slid on China’s enhanced crypto ban. By the 21st of September, the Arweave price was 55% lower, changing hands at $34. However, the AR token saw good buying on the dip and continues to trend higher, albeit in a choppy fashion. Arweave currently commands a respectable $1.7 Billion market cap despite the recent retreat, ranking it as the 65th-largest cryptocurrency.
AR Price Forecast
Drilling down into the 4-hour chart, we see a robust long-term trend line that supports the Arweave Price at $44.00. I consider this a significant level of support and the foundation of the three-month bull market. However, a more concise rising trend line at $50.60 is the immediate support.
If the AR token fails to hold the lesser trend support, a visit to $44 should follow. Moreover, if the price drops out of the longer-term uptrend, a decline towards the September low at $34 is possible. However, it’s worth noting that each previous test of the long term trend line has resulted in a material bounce in price. Therefore, buyers are likely to emerge towards the trend line. As long as AR stays above $44.00, its bullish trend is intact.
Arweave Price Chart (4-hour)

For more market insights, follow Elliott on Twitter.


