- Summary:
- AMD share price dips amid new AI partnerships. Discover key support and resistance levels and find out is it time to buy or stay cautious.
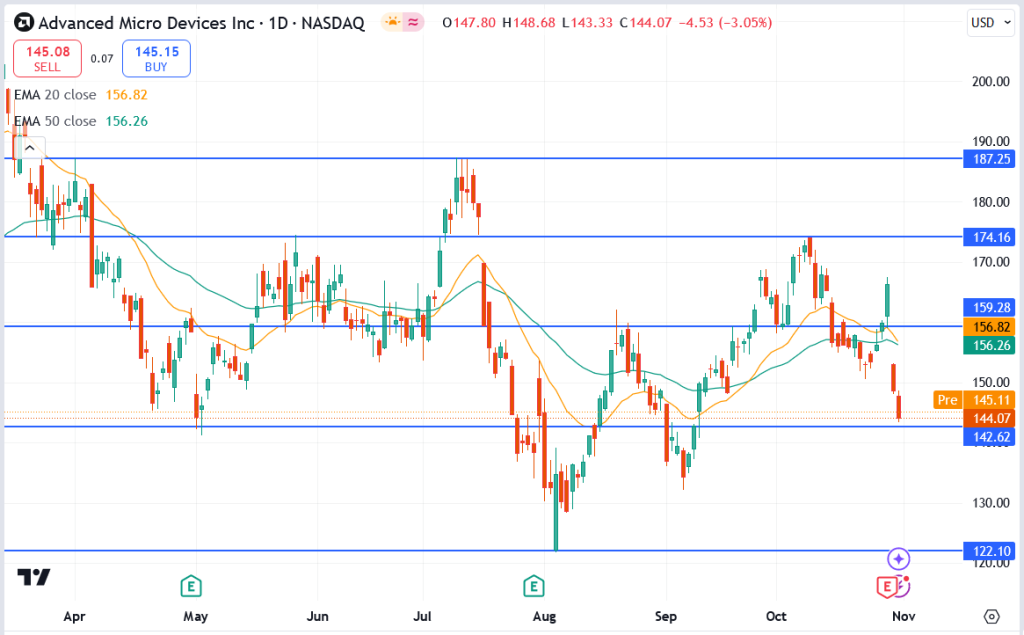
AMD (NASDAQ: AMD) has been a hot topic recently, with the stock taking a dip amidst general market volatility. As of today, AMD is trading at $144.07, down 3.05%, sparking questions about whether now’s the time to buy the dip or avoid further downside. With new AI partnerships on the table, let’s dive into what’s driving AMD’s performance this month.
AI Partnerships: Enough to Boost AMD’s Trajectory?
AMD has recently formed multiple prominent AI partnerships in order to strengthen its presence in the AI computing industry, directly challenging NVIDIA. These partnerships aim to increase AMD’s presence in AI applications in cloud computing, autonomous vehicles, and other areas. Many view these partnerships as AMD’s attempt to compete with NVIDIA’s dominance, leading to optimism in the market.
Nevertheless, the recent decrease in the stock indicates that investors are being careful and are holding off until they see actual outcomes from these collaborations. Although AMD’s foundation is strong, investors are seeking tangible evidence that the AI progress will generate revenue quickly.
Technical Analysis: Key Levels to Watch for AMD
AMD’s chart shows a volatile landscape, with critical levels that could determine the stock’s near-term trajectory:
- AMD’s Immediate Support: $142.62 – A break below this level could signal a continuation of the downtrend, with further downside risks.
- AMD’s Resistance Levels:
- $145.11 – First resistance to watch closely; a recovery here could indicate a reversal.
- $156.82 (20-day EMA) – Significant resistance that AMD needs to break through to regain bullish momentum.
- $159.28 – A breakout above this could pave the way for a stronger rally toward the $174 region.
With the current bearish momentum, breaking above these levels will be crucial for a sustained recovery. Otherwise, AMD might continue trending down to test the next support at $122.10.

Conclusion: Buy the Dip or Wait?
For now, AMD’s price action remains uncertain. While the recent AI partnerships provide a positive outlook, the technical setup suggests caution. Investors should consider waiting until a confirmed reversal occurs above important resistance levels before getting involved. Yet, individuals with a more extended perspective might see AMD’s decrease as a compelling opportunity to invest, considering the company’s solid presence in AI and computing.


