- Summary:
- The analysis of the BTCUSD pair shows that Bitcoin prices could break out of the bullish pennant and send prices towards the $45,000 mark.
Bitcoin prices are on the verge of a huge move if the pattern on the daily chart is anything to go by.
A look at the daily chart of the BTCUSD pairing shows what appears to be price trading within a huge triangle. In reality, this is a bullish pennant, and the price is now testing the upper border of this pennant.
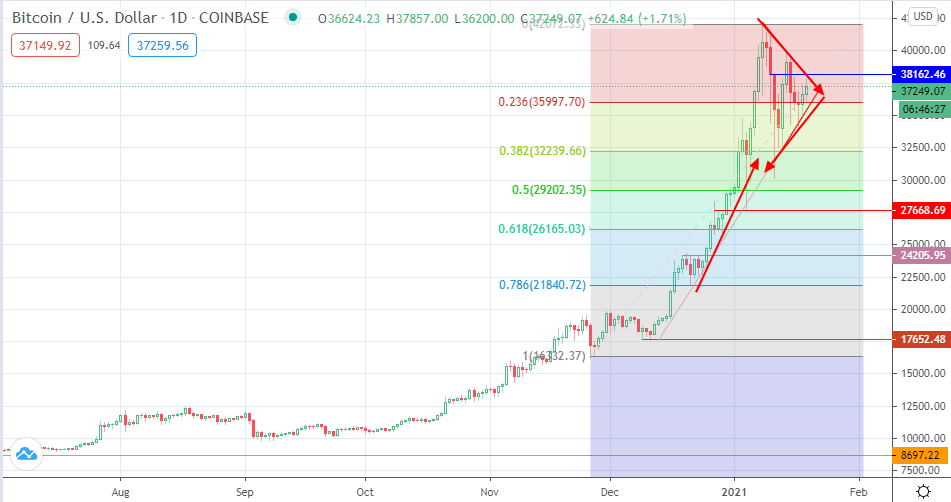
A pennant usually resolves in the direction of the trend that preceded the pennant consolidation area. For Bitcoin prices, this points to a move higher if the breakout follows the pattern’s expected resolution. With a pole that is nearly $9,000 in length, a bullish break could see Bitcoin prices aiming for a projected price of 45,972.96, which is the 423.6% Fibonacci extension from the price swing of 8 March to 18 August 2020. This move is expected to take out the resistance targets at 37781.92, 38988.48 and 40721.85. This move is also expected to undergo a series of flows and ebbs, and not perform a straight dash for the top.
On the flip side, a downside break of the consolidation area negates the pattern and opens the door for the price to attain the 35470.75 and 32224.93 price levels. 30491.55 and 29284.99 are also additional targets to the south.
BTCUSD Daily Chart