
- Summary:
- The S&P 500 seems to be approaching a critical juncture, raising the question: could a correction be on the way?
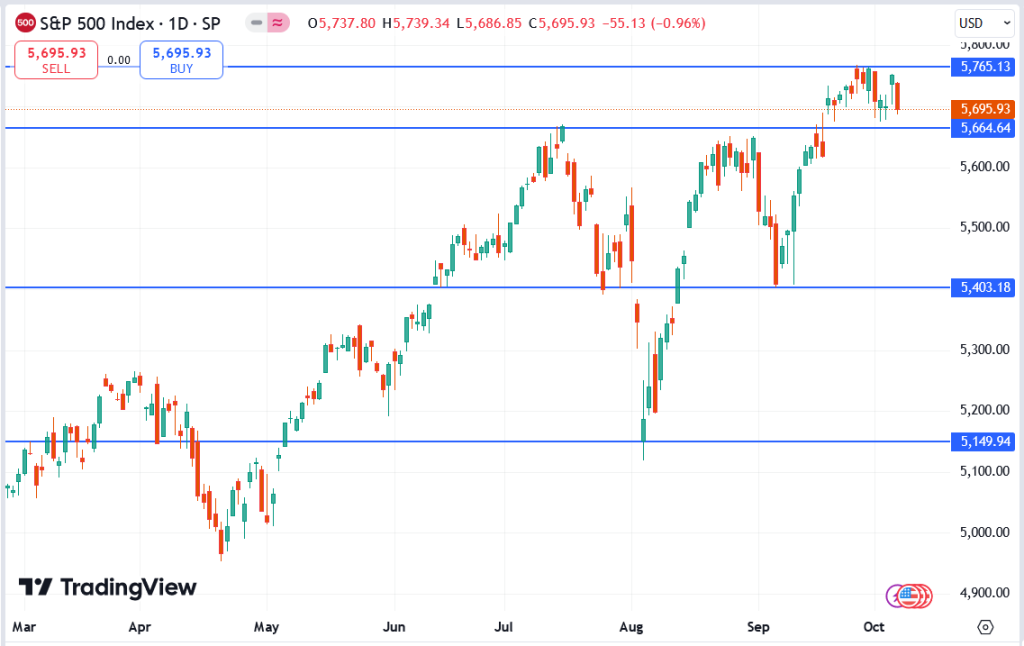
The S&P 500 seems to be approaching a critical juncture, raising the question: could a correction be on the way? After a steady rise over the summer, the index is showing signs of hesitation, with current levels hovering around the key support at 5,664. This zone has held firm in recent trading sessions, but the struggle to break above 5,765 resistance may signal a shift in market momentum.
S&P 500 Key Support and Resistance Levels to Watch
On the daily chart, this back-and-forth movement highlights potential weakness. Repeated attempts to surpass 5,765 have failed, suggesting that sellers could soon step in. If the support at 5,664 doesn’t hold, the next significant level sits at around 5,403, where the S&P 500 found support in August. A dip below this point might encourage further selling, pushing the index lower.
External Factors That Could Drive Market Volatility
Traders should monitor upcoming Federal Reserve updates and any shifts in bond yields closely, as these external factors often have a direct impact on equity markets. While the current setup doesn’t guarantee a correction, the technical landscape suggests heightened volatility is on the cards. If support levels give way, we could see the S&P 500 entering a broader pullback phase.