- Summary:
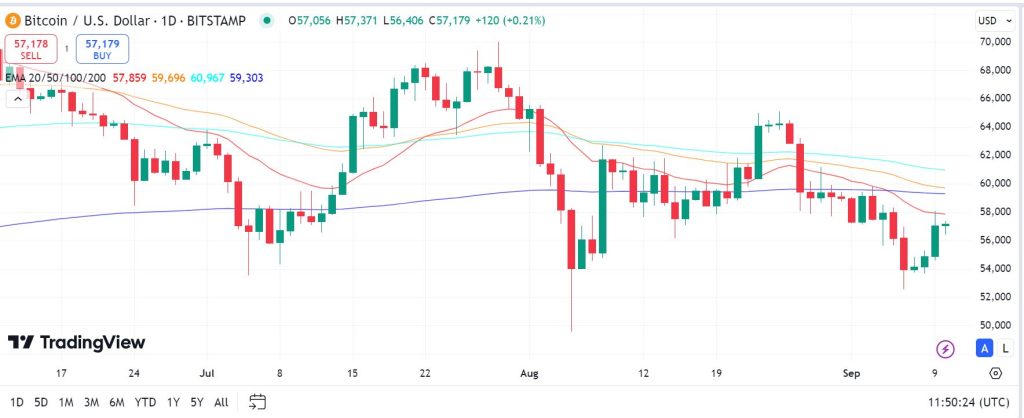
- Bitcoin price trades below 20,50,100 and 200 EMA levels on the daily chart, presenting a good opportunity to buy as market signals recovery.
Bitcoin price seems to have found strength above the psychological pivot mark of $55,000. The BTCUSD pair extended its gains on Tuesday, going up by 0.2 percent on the daily chart to trade at $57,185 at the time of writing. Bitcoin is now on track to record the fourth successive daily gain, a streak not seen since mid-July.
The crypto market’s return above the $2 trillion market capitalisation mark is symbolic, coming at a time when there’s renewed optimism over the US economy. The Federal Reserve is expected to announce the first interest rate cut since 2020 on September 18, and investors are counting on the announcement to precipitate sustainable growth.
Markets have radiated bubble-like sentiment for the better part of the year, with cryptocurrencies finding themselves sucked in. Bitcoin price has suffered the consequences of closer integration with the equities markets, partly due to its ETF approvals earlier this year. Therefore, with the bearish market contagion lifting off, we are likely to see Bitcoin price assuming a more stable upward trajectory.
As seen on the chart below, Bitcoin price is at -6.2 percent on the monthly chart and 21.8 percent in the last six months. In addition, it is below the 20,50, 100 and 200-EMA levels on the daily chart, providing a good entry point. Notably, the price is currently approaching the 20-EMA mark of $57,859, signaling growing stability above the $57 k mark.
Bitcoin price forecast
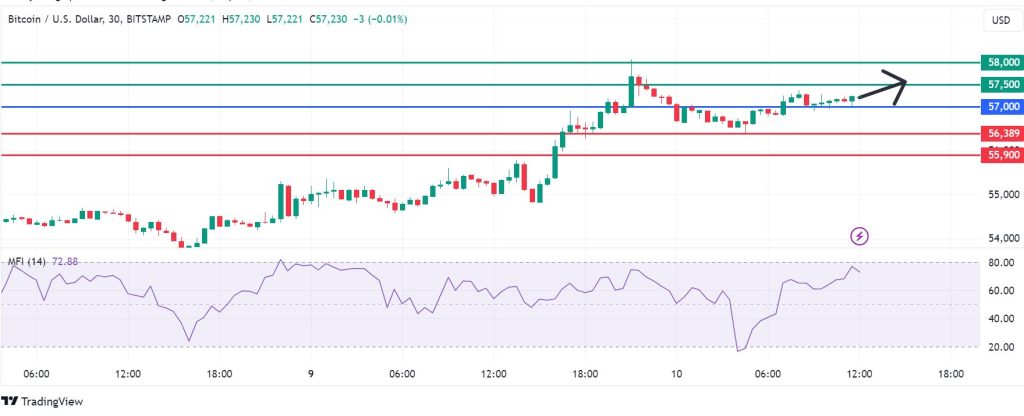
Bitcoin price will likely follow the upward trajectory if it stays above the $57,000 pivot mark. That will likely see the establishment of the first resistance at $57,500. Further bullish momentum beyond that point will breach above that barrier and test $58,000.
Alternatively, moving below $57,000 will signal bearish control. In that case, the first support will likely be at 56,389. However, if the sellers extend their control, it will enable a break below that mark, invalidating the upside narrative and possibly testing $55,900.