- Summary:
- Solana price has stagnated around the $160 mark in recent days. Could this be down to Tron, or is there more to it?
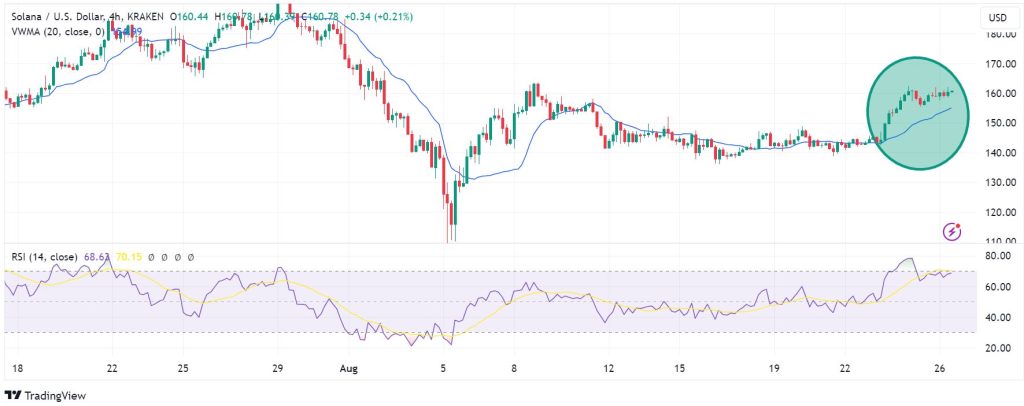
Solana price seeks stability above the $160 mark for the third day in a row, with that level building up to be a potential support mark. Solana traded at 161.70 at the time of writing on Monday, having edged up +1.7 percent. The crypto coin has gained more than 11 percent in the last week, but a return to the $160 mark seems to have slowed down the momentum.
What’s moving Solana price?
One of the key drivers of Solana price in recent days has been the prospect of the approval of its ETF applications by the Securities and Exchange Commission (SEC). However, there has been a concerning silence on that front, giving rise to speculation that the SEC could have rejected the application.
Also, the Solana blockchain’s ecosystem appeal has come under pressure, following Tron’s launch of the SunPump meme coin launchpad. SunPump recently outperformed Solana’s Pump.fun platform in terms of the number and value of meme coins launched. Meme coin mania helped propel SOLUSD this year, but Tron could spoil the party.
Therefore, Solana price will likely struggle to replicate the July momentum that propelled it above $190 as the hype surrounding SunPump grows in the near-term. Meanwhile, Tron has also outperformed Solana in the DeFi front, with its monthly gains at 2.6 percent versus Solana’s loss of 1 percent, according to DeFiLlama.
Momentum indicators, support and resistance levels.
On the 4-hour chart below, Solana price trades above the Volume Weighted Moving Average (VWMA), which is currently $154.99, signaling bullish control. Also, support for the upside is shown by the RSI which is at 68 .

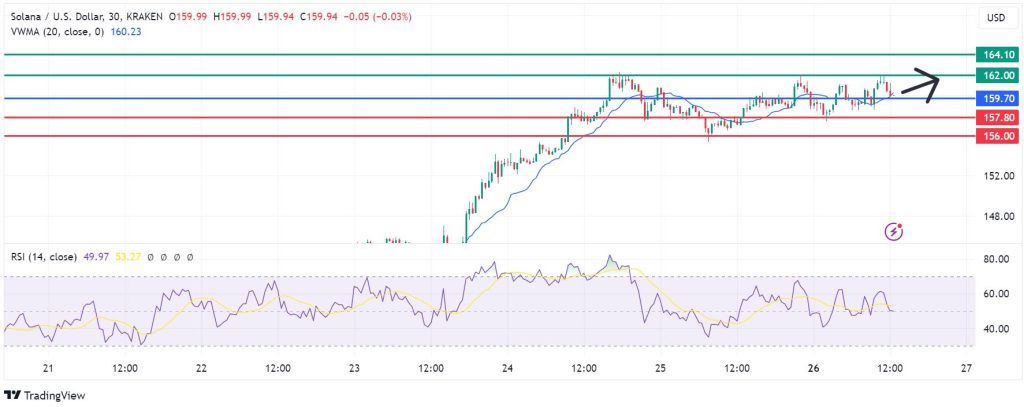
Meanwhile, the 30-minute chart also points to the continuation of the upside if the price action stays above the 159.70. In that case, we could see the first resistance encountered at 162.00. However, if the buyers extend their control, they could build the momentum to break above that level and test 164.10.
On the other hand, a move below 159.70 will strengthen the sellers to take control, and the downward momentum will likely find initial support at 157.80. However, if they extend that control, the sellers could break below that mark and potentially test a lower support at 156.00. At that point, the upside narrative will be invalid.


