- Summary:
- MCOIN price nosedived to all-time lows two weeks ago, and its recovery had been slow until a day ago. What does this mean for investors?
MCOIN price has registered a stellar run in the last 48 hours, coming to life after nosediving to record lows two weeks ago. The crypto asset extended its rally on Friday, going up by 3.7 percent on the daily chart to trade at $0.408. That means it has recovered by 36 percent from its historic lows.
However, a good run in the last two days, of which it gained 10 percent on Thursday alone, might signal volatility, that might not be strong enough to build a sustainable bullish upturn. A sharp bearish trajectory on the daily chart attests to the underlying strong bearish sentiment that could slow down gains by MCOIN price.
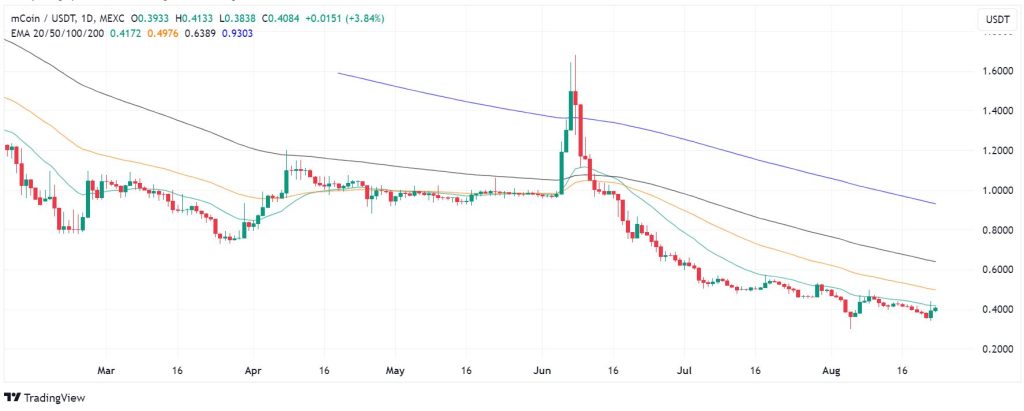
Despite its recent gains the M20 blockchain coin trades below its 20, 50, 100 and 200 Exponential Moving Average (EMA). That means that most holders are likely in loss-making positions. Consequently, that might dissuade a selloff in the near-term. However, a return near the 20 or 50 EMA levels in the $0.417-$0.497 range over the weekend could potentially trigger some profit-taking, which could exert pressure on the price.
Mcoin price momentum indicators
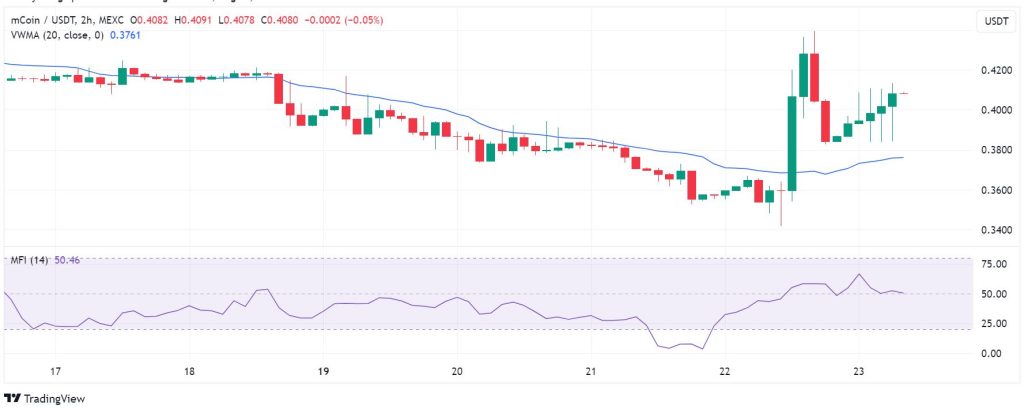
The MCOIN price momentum on the 2-hour chart shows that the buyers currently have control. The price is well above the Volume Weighted Moving Average to affirm this view. However, the Money Flow Index (MFI) indicator reading calls for a cautious approach to the bullish view. With the reading at 50, the MFI is in the neutral-to-bearish zone, as opposed to a strong positive money flow.
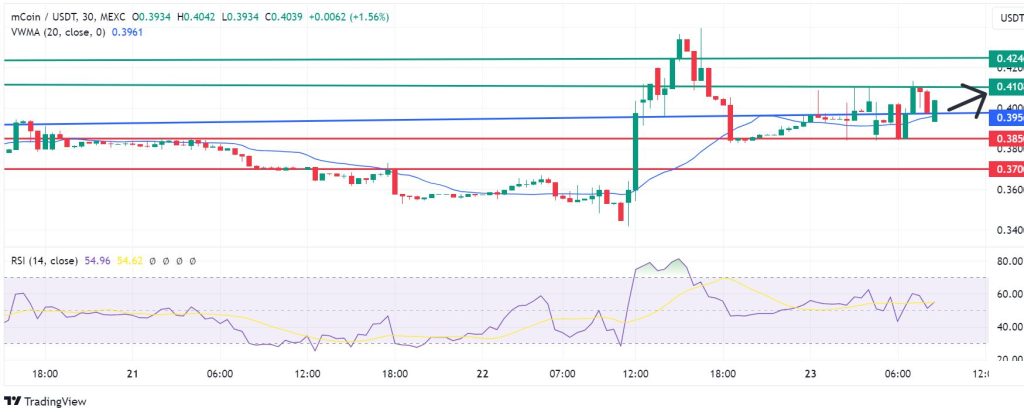
Support and resistance levels
On the 30-minute chart below, the bulls will likely have control if they keep the price above the pivot mark at 0.395 level. That could see them move further up to 0.410, where they could encounter the first resistance. However, they could break above that barrier if they extend their control, with the resulting momentum potentially enabling them to move higher to test the second resistance at 0.424.
On the other hand, the bears could take control if the price slips below 0.395. If that happens, we could see the first support established at 0.385. However, extended control could enable the sellers to breach that level, invalidating the upside narrative and potentially testing 0.370.