- Summary:
- Bitgert price hit year-to-date lows on August 5, and continues to trade sideways below 20,50 and 200 SMAs. So, how can it break out upwards?
Bitgert (BRISE) price continued sending mixed signals on Thursday, rising by 1.3 percent but failing to get out of its sideways trajectory. The crypto asset has struggled to find a decisive rhythm either to the upside or downside, since it hit year-to-date lows on August 5. At the time of writing, BRISE was at 0.0000000976, about 17.3 percent above the YTD low level, but at -51.5 percent overall YTD. Also, it is at -23 percent on the monthly chart.
As a result, sentiment surrounding BRISE price is mostly bearish, despite its recent gains on the daily chart. At its current price, the crypto coin is below the daily 20, 50, and 200 Simple Moving Average (SMA) levels, underlining the strong bearish momentum. However, that could potentially turn out for good if investors opt to hold on to BRISE rather than sell it.
Bitgert’s biggest drawback is that it has failed to attract users despite its claims of offering high-speed, zero-fee transactions. With a fully diluted market cap of $97.4 million, a market cap of $38 million, and a circulating supply of 395 trillion tokens, it is not difficult to see why some investors don’t consider it investment-worthy.
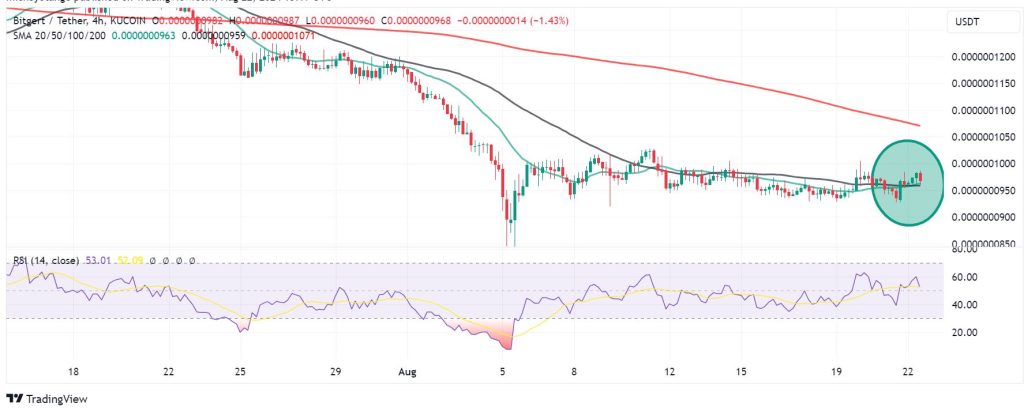
Momentum indicators
On the 4-hour chart, BRISE price has recently crossed above both the 20-SMA and 50-SMA. In addition, the 20-SMA indicator has also crossed above the 50-SMA, signalling the building up of a bullish momentum. However, both SMAs are below the 200 by wide margins, adding credence to the bearish undercurrent narration. The resulting sentiment has limited gains by Bitgert price.
Also note how the token was previously rejected multiple times at the 0.000001000 mark, and that led to a continuous sideways movement. That implies that a break above that psychological level could generate the momentum to sustain an uptrend in the near term. However, the Relative Strength Index (RSI) indicator reads 53, which could form the basis for some bullish gains in the near-term.
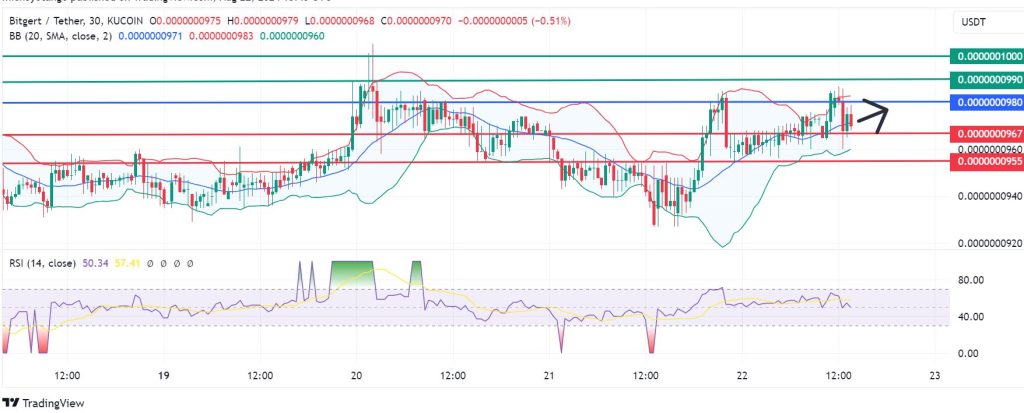
Support and resistance levels
The momentum on the 30-minute Bitgert price chart below signals that the buyers are in control above the 0.0000000980 pivot. With that momentum, look for the first resistance at 0.0000000990. However, extended control by the bulls could enable them to break above that mark and test 0.000000100. Conversely, a move below 0.0000000980 will favour the sellers to take control, with the first support likely to be at 0.0000000967. However, extended bearish momentum could breach that support and send BRISE to test 0.0000000955.