- Summary:
- Gold price broke below the $2,400 per ounce mark on Monday, pitting the buyers in control to potentially extend losses ahead of key US data
Pressure mounted on gold prices on Monday, as the commodity stared at a fourth consecutive session of losses. The precious metal was down by 0.1 percent at the time of writing to trade at 2,395, breaking below the key psychological support mark of $2,400. The current decline is attributed to profit-taking by investors, as gold’s safe haven attraction declines. This week is action-packed for the XAU/USD pair, with the second quarter US GDP figures and Personal Consumption Expenditure (PCE) index release expected to inject fresh volatility.
Momentum indicators
The RSI momentum indicator is currently at 52, signaling that the upside momentum is stronger than the selling pressure. Also, the 20-Simple Moving Average (SMA) is above the 50-SMA, with the crossover having happened a week ago. This signals a strong underlying upside momentum that could help the price recover. That said, the price is marginally above the signal line on the Bollinger Band indicator, which could provide support for a price recovery. Conversely, a break below that level could signal control by the sellers, favouring the downside momentum.
The Fibonacci Retracement indicator on the 4-hour gold price chart shows that the downtrend was initially interrupted at the 23.6% retracement level ($2,406). Therefore, that mark will likely be the resistance mark in the near-term. Similarly, a break above that mark will signal a likely reversal to the upside.
Near-term support and resistance levels
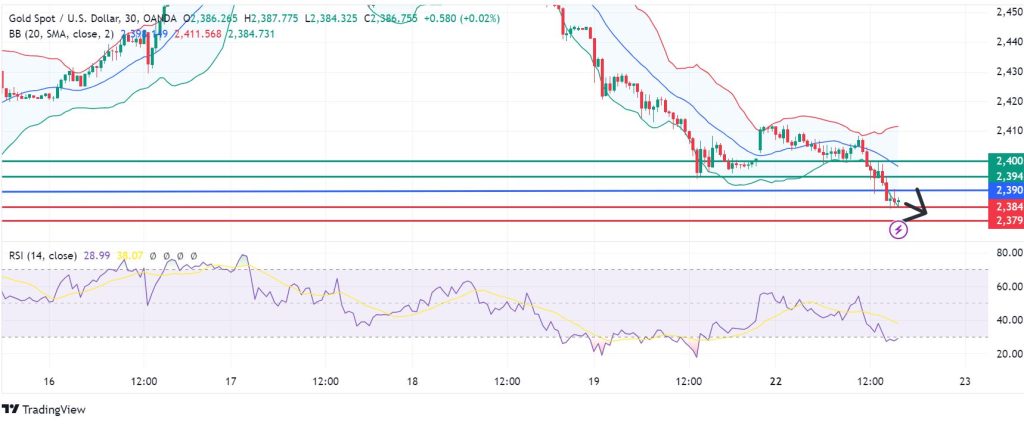
The momentum on gold price is likely to continue to the upside if the action stays above the 2,390 support level. That could see further advances to encounter the first resistance at 2,406, but extended control by the buyers could propel movement to test 2,400. Conversely, a move below 2,390 will favour the sellers to take control, with the first support likely to come at 2,384. Extended control by the sellers could break that mark, at which point the upward narrative will be invalid. Furthermore, that could result in more losses to test a lower support at 2,379.