- Summary:
- Silver price has done well in the past few months as the US dollar index has taken a hit. It also plunged as the gold/silver ratio
- Silver price has made a spectacular rebound in the past few months.
- It has surged by more than 42% from the lowest level in 2022.
- The rally has coincided with the sharp decline of the US dollar index.
Silver price has done well in the past few months as the US dollar index (DXY) has taken a hit. It also plunged as the gold/silver ratio dropped to the lowest level since April 2022. Silver has led the charge, rising to $24.73, which was the highest level since April 22. It has jumped by more than 37% from the lowest point in 2022. Similarly, the iShares Silver Trust (SLV) has surged by a similar range.
Gold/silver ratio and US dollar index (DXY) retreats
Silver price has been in a strong bullish trend in the past few weeks as investors react to the performance of the US dollar. The dollar index, which tracks the performance of the greenback against a basket of currencies, has been in a strong bearish trend since September. It has fallen from the 2022 high of $114.8 to a low of $103.44. This happened as data pointed to weaker American inflation. In November, the headline inflation figure dropped to 7.3% from the previous 7.7%.
The US dollar has an inverse relationship with the silver prices. In most periods, silver tends to rise when the US dollar index falls and vice versa. This happens because of silver’s characteristic as a precious metal. Like gold, silver reacts to the actions of the Federal Reserve, which is responsible for setting America’s monetary policy. The Fed has recently embraced a more hawkish tone in a bid to fight inflation. Analysts expect it to implement another 0.50% rate hike in February followed by 0.25% in March. The next key catalyst for silver prices will be the upcoming Fed minutes. These minutes will provide more color about what the Fed will do in its coming meetings.
Silver price has also soared as the gold/silver ratio has dropped to the lowest level in months. This ratio shows the number of silver bars that can buy an ounce of gold. A lower figure shows that silver is relatively undervalued.
Silver price forecast
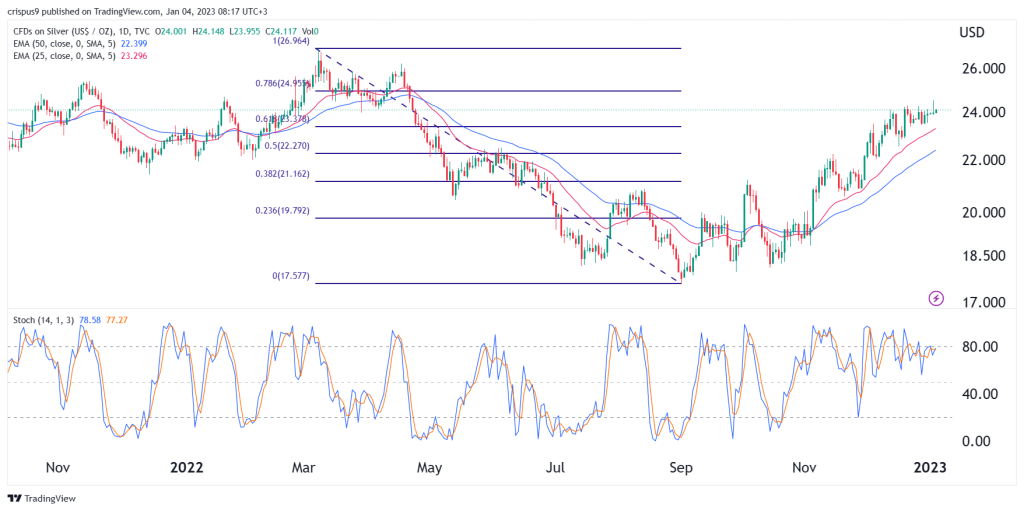
The daily chart shows that the XAG/USD price has been in a strong bullish trend in the past few months. It has moved from a low of $17.64 in September to almost $25. Silver prices have also moved above the 61.8% Fibonacci Retracement level and above the 25-day and 50-day moving averages. The. Stochastic Oscillator has moved above the overbought level of 80. It also formed a golden cross pattern, where the 50-day and 200-day moving averages make a crossover.
Therefore, silver will likely continue rising as buyers target the important resistance level at $26. A drop below the support level at $23 will invalidate the bullish view.


