- Summary:
- The Nasdaq 100 index remained in a consolidation phase in the past few days as investors wait for the upcoming FOMC minutes.
The Nasdaq 100 index remained in a consolidation phase in the past few days as investors wait for the upcoming FOMC minutes. It was trading at $11,634, where it has been in the past few days. This price is about 11.58% above the lowest level this year. The Dow Jones, Russell 2000, and S&P 500 are also consolidating while the fear and greed index is at 62.
Fear and greed index in the green
The Nasdaq 100 index strong recovery has faded in the past few days as concerns about the Fed pivot remain. Several Fed officials like Mary Daly, Raphael Bostic, and Loretta Mester have said that they will be supportive of a pivot. Others like James Bullard have warned that higher interest rates are needed for a while.
The upcoming FOMC minutes will provide more color about the Federal Reserve. It will provide more information about the deliberations that happened during the Fed meeting. In it, the bank decided to hike interest rates by 0.75%. The accompanying statement was relatively hawkish as the Fed committed to leave rates at an elevated level for a while.
Most Nasdaq 100 constituents have rallied in the past 30 days. Some big constituents have nonetheless disappointed. Atlassian stock price has crashed by over 38% while Amazon, Airbnb, Tesla, Lucid, and Meta Platforms have crashed by over 15%. Other top laggards in the Nasdaq and QQQ are CrowdStrike, Okta, Intuit, and DocuSign among others.
On the other hand, the best performers in the Nasdaq 100 index are Moderna, JD, ASML, Ross Stores, and AMD. All these shares have jumped by over 25% in the past 30 days. Most of them have done well because of the past earnings season. Some of the top firms scheduled to publish their results this week are Zoom Communications, Dell Technologies, Dick’s Sporting Goods, Warner Music Group, and Deere.
Nasdaq 100 forecast
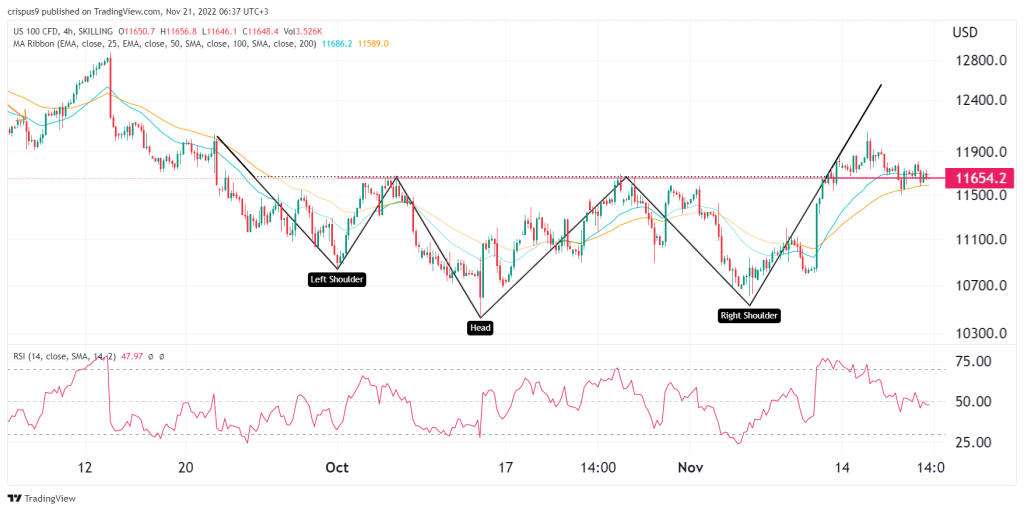
The four-hour chart shows that the Nasdaq 100 index has been under pressure in the past few days. It is now trading at $11,654 where it has been in the past few days. This price is an important level since it was the highest point on October 25. It is consolidating at the 25-day and 50-day moving averages while the Relative Strength Index (RSI) has formed a bearish divergence pattern.
It has also formed a small head and shoulders pattern. Therefore, the index will likely have a bearish breakout as sellers target the next key support level at $11,000. A move above the resistance at $11,817 will invalidate the bearish view. An important hope for the index is that it has formed a big H&S pattern that is shown in black.


