- Summary:
- Glencore share price has been in a tight range in the coming weeks amid heightened concerns about the global economy.
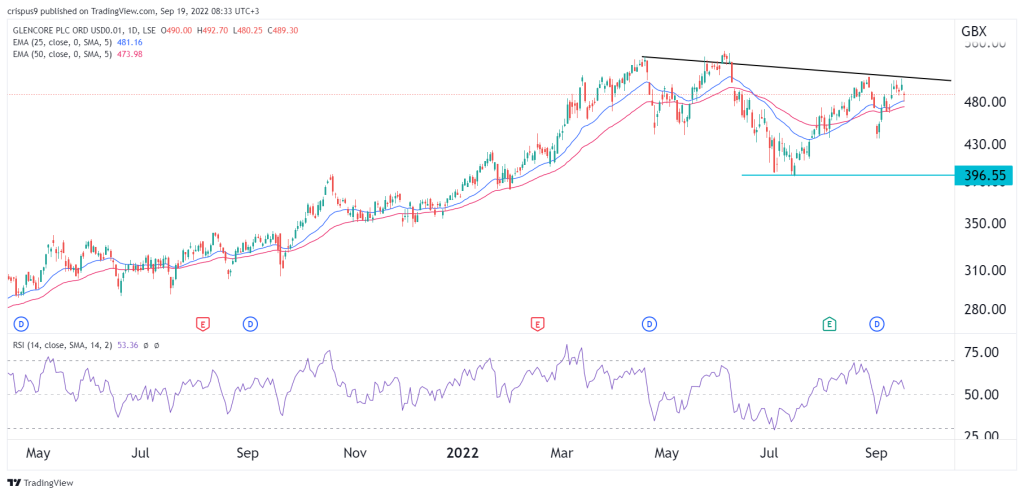
Glencore share price has been in a tight range in the coming weeks amid heightened concerns about the global economy. The GLEN stock price was trading at 489p, which was slightly below last week’s high of 512p. It has risen by about 23% from the lowest level in July of this year, giving it a market cap of over 62 billion pounds.
Glencore stock price has outperformed other mining companies like Anglo American, Rio Tinto, and BHP. The biggest concern among mining stocks is that the global economy is on a verge of a recession, which has pushed commodity prices lower. For example, copper prices have dropped by over 30% from the highest point this year. Similarly, nickel futures have collapsed by over 62% from their all-time high while zinc futures dropped by 26%.
As a mining company, Glencore makes money when commodity prices rise, which explains why its stock price has retreated in the past few months. However, unlike several companies, Glencore’s business has been offset by the rising demand for coal as countries prepare for the winter season. This is notable since Glencore makes most of its money from the coal segment.
Glencore is also making a lot of money trading crude oil. This is a notable thing since Glencore is one of the biggest oil trading companies in the world. It markets over 4 million barrels of oil per day. As such, the company is making a lot of money buying and selling oil. For example, it owns Astron, a leading oil marketing company in South Africa.
Glencore share price forecast
The daily chart shows that the GLEN share price has formed a triple-top pattern that is shown in black. A triple-top is usually a bearish sign. The neckline of this pattern is at 396p, which was the lowest level on July 15. It has also moved slightly above the 25-day and 50-day moving average while the RSI has moved slightly above the neutral point at 50.
Therefore, the stock will likely have a bearish breakout in the coming weeks. If this happens, the next key support level to watch will be at 396p, which is about 20% below the current level. A move above the resistance point at 520p will invalidate the bearish view.


