- Summary:
- The gold price action indicates a slight recovery ahead of today's producer price index data from the Bureau of Labor Statistics.
Gold price action is up 0.18% this Wednesday, recovering only a portion of the heavy losses it sustained yesterday after consumer inflation data from the United States showed that prices at the shops and retail outlets were increasing.
Data from the Bureau of Labor Statistics released on Tuesday showed that the consumer price index for August rose 0.1%, which was one percentage point higher than July’s number, and also beat the market’s expectations that had projected a 0.1% reduction. Core CPI (ex. food and energy prices) rose 0.6%, higher than the previous month’s 0.3% increase and also more than the consensus, which saw no change from the last figure.
The sharply higher data set reignited the market’s expectations that the Fed would continue on its aggressive rate hike pathway when it releases the new interest rates in a week. This led to a selloff in gold price, with a 1.36% drop recorded on Tuesday. This Wednesday, the Bureau of Labor Statistics releases the Producer Price Index. The market expectation is for a 0.1% drop.
Gold Price Forecast
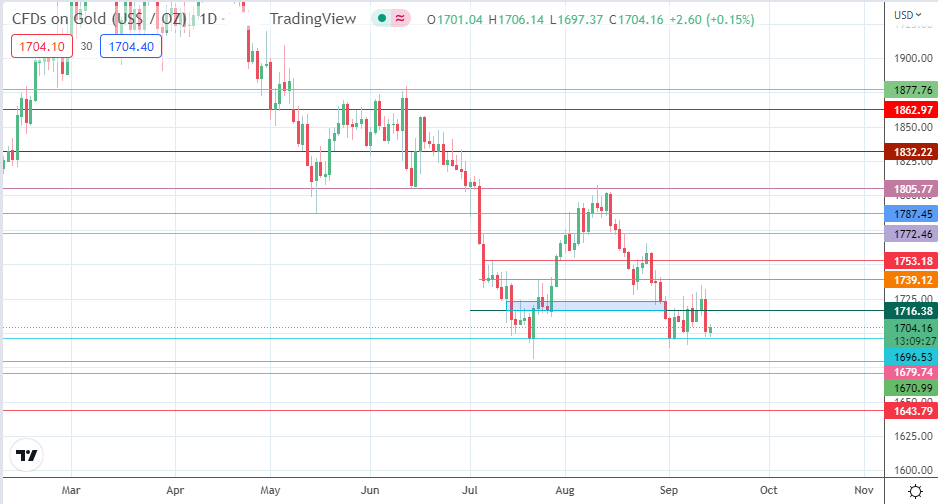
The intraday uptick comes off the 1696 support level, which remains the barrier to beat for the bears. A breakdown of this level opens the door for a push toward the 1679 support (8 March/31 March 2021 double bottom). Before then, the 9 August 2021/21 July 2022 lows at 1681 may serve as a pitstop. The 1 May 2020/5 June 2020 lows at 1670 serve as the next target to the south, followed by the 9 April 2020 low at 1643.
However, this bearish view is invalidated if the 1716 resistance barrier is broken, clearing the way for a further push toward the 1739 resistance (22 July and 30 August highs). There are additional upside targets at 1753 (8 July high) and 1772 (6 July and 18 August highs). 1787 (16 May low and 2 August high) only becomes available if the 1772 barrier is breached. The 14 June low/10 August high at 1805 rounds off potential barriers to the north.
XAU/USD: Daily Chart


