- Summary:
- The bullish flag formation holds the key to the Darktrace share price hitting 700p, if the fundamentals go the right way.
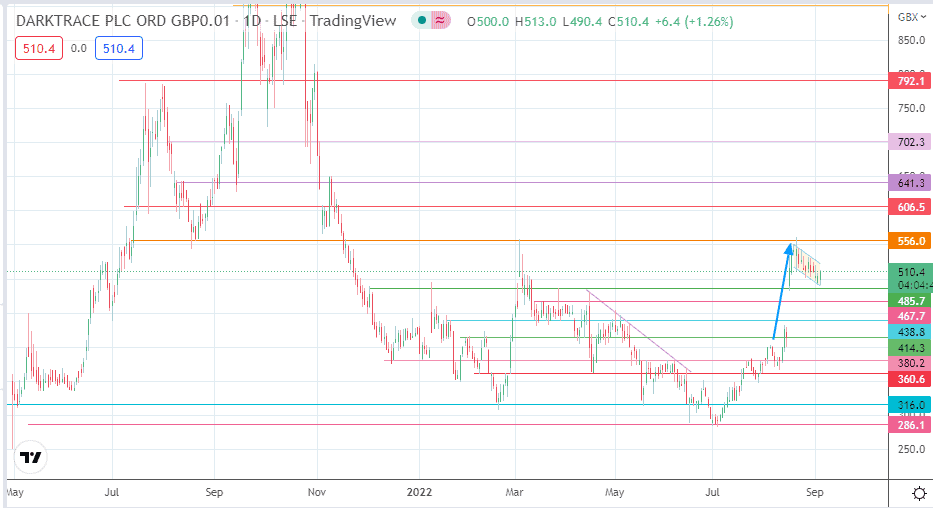
The Darktrace share price is up % this Monday, as the stock aims to bounce back from the recent corrective move that followed its earlier announcement of a potential takeover by Thoma Bravo. The stock had seen a 24% jump on 16 August when the takeover talks became public. However, pushback from the company’s investors and the UK government over the deal’s valuation has brought about a modest correction in the Darktrace share price.
Darktrace upgraded its full-year earnings outlook in July 2022, sparking a rally in the stock from 283.7p on 1 July to the 12 August high of 431.1, just before the takeover news sparked the sharp uptick in the Darktrace share price. Darktrace is expected to announce its full-year results on 8 September. This will provide some insight as to the future direction of the stock.
If the earnings match or surpass July’s growth guidance of a 34% revenue increase, the Darktrace share price would be in good stead to aim for a much higher push. From the technical analysis standpoint, there is an emerging bullish flag pattern. An earnings beat provides a fundamental trigger for the pattern to achieve completion at 700p.
Darktrace Share Price Forecast
The upper border of the evolving flag is being tested. If this border gives way, the Darktrace share price would have valid grounds to aim for completion at 702.3 (4 August and 2 November 2021 highs).
To attain this target, the bulls need to take out the resistance levels at 556.0 (3 March and 19 August highs) and 606.5 (3 November and 12 November 2021 highs), along with the 641.3 barrier formed by a previous high of 11 August 2021. The neckline of the 24 September 2021 and 18 October 2021 double top located at 792.1 forms an additional upside barrier if the bears fail to defend 702.3.
On the flip side, failure to complete the pattern via a rejection at the evolving flag’s upper border sets the price action toward the 485.7 support (1 December 2021 and 25 March 2022 highs). If the bears break down this support, 467.7 becomes a new downside target (16 March 2022 high). Below this level, further price deterioration takes the price toward 438.8 (10-28 March lows) and 414.3 (31 January high and 11 April low). The downside move covers the upside gap of 16 August.
Darktrace: Daily Chart


