- Summary:
- Gold price sell-off gained steam as traders waited for the upcoming American inflation numbers. What next for the XAU/USD pair?
Gold price sell-off gained steam as traders waited for the upcoming American inflation numbers. The XAU/USD price slumped to 1,728, which was the lowest level since October 2021. It has crashed by more than 16% from the highest point this year. This price action is in line with that of other metals like silver and copper.
Is gold still an inflation hedge?
Gold, unlike other metals like silver, copper, and lead, does not have any major industrial uses. As such, most of it is usually bought by large investors and central banks. These buyers see it as a real store of value and a hedge against inflation. The view is that gold tends to do better than the US dollar and other assets in times of high inflation.
However, the gold price has failed its most important test in decades. While American inflation has surged to a four-decade high, gold has fallen by double digits. The same is true for global inflation, which has surged this year. Gold has fallen because of the ongoing sell-off in metals and the supercharged US dollar.
The next key catalyst for the XAU/USD pair will be the upcoming American inflation data scheduled for Wednesday. Economists expect the data to show that the country’s consumer inflation surged from 8.6% in June to 8.8% in July this year. If analysts are accurate, it will be the highest it has been in more than four decades.
These inflation numbers will have implications for the XAU to USD pair. Besides, they will make the case that the Federal Reserve will continue tightening its policies in the coming months.
Gold price forecast
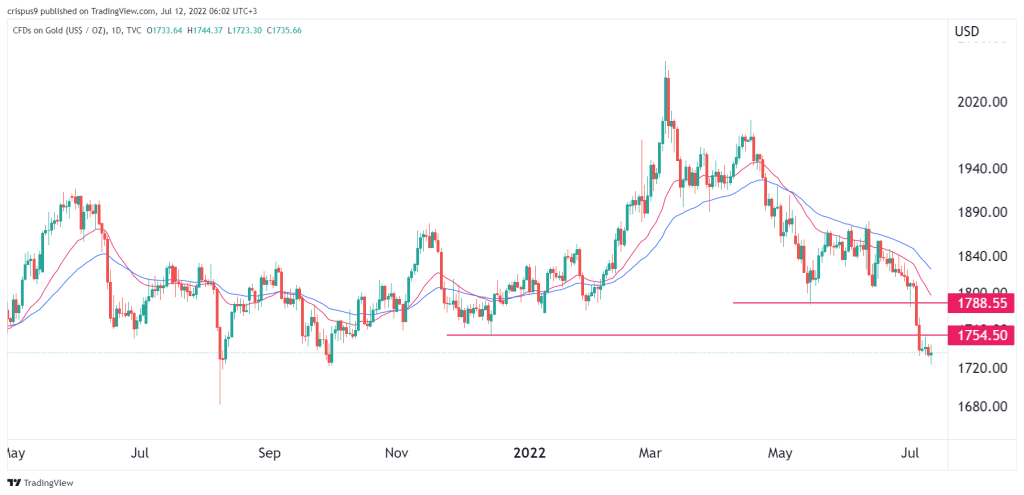
Turning to the daily chart, we see that gold has continued falling below important levels of support lately. It declined below the key support at $1,788, which was the lowest point on May 16th. It also moved below the support at $1,754, which was the lowest point in December. The bearish trend is being supported by the 25-day and 50-day moving averages.
Therefore, the gold price will likely continue falling as sellers target the support at $1,680. A move above the resistance point at $1,754 will invalidate the bearish view. Use the InvestingCube’s S&R indicator for live gold forecasts.


