- Summary:
- Gold price has been on an uptrend since 2018. However, its performance in 2024 has been breathtaking. Check our gold price forecast now.
Table of Contents
- XAU/USD gets tailwinds from weak dollar fundamentals
- Falling Treasury yields a source of tailwinds for gold price
- Gold news
- XAU/USD and Its Correlation With The DXY Index
- Gold Price Historical Chart
- Gold Price Forecast & Latest Analysis
- Gold Price Forecast 2025
- Gold Price Forecast 2030
- How to invest in gold
- Best gold stocks to invest in
- Gold futures
- Gold ETFs
- Summary
Gold price (XAU/USD) broke multiple records between March and August 2024, and it is going on to register all-time highs of $2,531 per ounce on August 20 at the spot market. The yellow metal’s propulsion this year has mostly been as a result of the geopolitical risk in the Middle East fand soft US macroeconomic data, which have combined to raise prospects of up to three three Fed interest rate cuts, starting September 2024. Notably, its price trajectory beginning June was also contrarian, rising when inflation was cooling in United States and Europe.
That said, gold prices were down by 1.25 percent on the daily chart as of this writing to trade at $2,480 per ounce in the spot market, as buyers tamed their appetite ahead of a highly-awaited speech by Federal Reserve Chairman Jerome Powell. The Fed Chair is expected to give guidance on the extent of the anticipated rate cuts, with the debate ranging widely from lows of 50-to-100 basis points in the last third of the year.
Also, the safe haven demand for the precious metal bubbles under as the Israel-Hamas war takes a new dimension, with ceasefire talks making minimal gains in August. However, China’s move to pause purchases in May, June, and July has put a lid on demand-side gold price rise.
XAU/USD gets tailwinds from weak dollar fundamentals
The US dollar has eased down in August as a series of soft macroeconomic data weighed in. First, the Nonfarm Payroll (NFP) data showed that 114,000 jobs were created in July, substantially lower than the forecast figure of 175,000. Also, the PCE and CPI readings had headed down for successive months beginning May. Furthermore, unemployment rate US rose from April through July, triggering recsssion fears in early August.
In the wake of these figures, the dollar has weakened against major world currencies. The DXY index, which weighs the greenback against a composite of six other currencies, slid to year-to-date lows of 100.92 on August 21st.
Falling Treasury yields a source of tailwinds for gold price
US Treasuries are substitutes for gold as far as safe-haven investments go, and falling rates on these assets have tilted the scales in favour of the yellow metal. As of this writing, yields on the benchmark 10-year bonds were at 3.86%, losing their ground against non-yielding gold. This will likely supply upward propulsion on the XAUUSD trading pair in the near-to-middle term.
Please note that the original article was published in September 2022. However, we update it regularly to incorporate all the latest information. You are also welcome to join my free Telegram group for up-to-date analysis on Gold & Bitcoin.
Gold news
The US dollar sits precariously after the US economy released a series of weak data in recent weeks. A rise in the unemployment rate, a decline in NFP jobs and a higher-than-expected initial jobless claims filings underline the rising pressure on the US dollar and support for gold’s upside.
In the latest case, Initial Jobs Claims figures came in at 232,000 in the week ending August 17, matching analysts’ forecast figure. This has raised hopes of potential 50 basis points cut in September. The Federal Reserve is expected to announce its first rate cut from the four-year-old 5.25%- 5.50% rate in its September decision, and that rate is expected to spur investor appetite for gold.
Elsewhere, China did not buy gold for the third successive month in July. The country’s central bank had been on a buying spree that saw it import gold for 18 straight months to April 2024, as it sought to cushion itself against the downside of overexposure to the the dollar. China currently holds about 2,264 metric tonnes of gold, constituting about 4.9 percent of her forex reserves, the highest ever on record.
China’s economy flashed signs of contraction for the three-month period to July, with its Purchasing Managers Index (PMI) readings below the 50 percent mark in each of the three months. Coupled with recent soft US economic data, the trend could trigger a spike in the demand for safe-haven gold.
Furthermore, there has been a notable increase in retail purchases of gold amid a troubled property market. These developments have combined to provide upside propulsion to gold prices and will likely continue to provide support in the mid-term.
XAU/USD and Its Correlation With The DXY Index
The dollar strength index tracks the strength of the USD against a basket of major global currencies. This index has recently hit YTD lows of 100.15 and could go lower. In the event the DXY index drops below 100 points, it is very hard to see gold below $2,500.
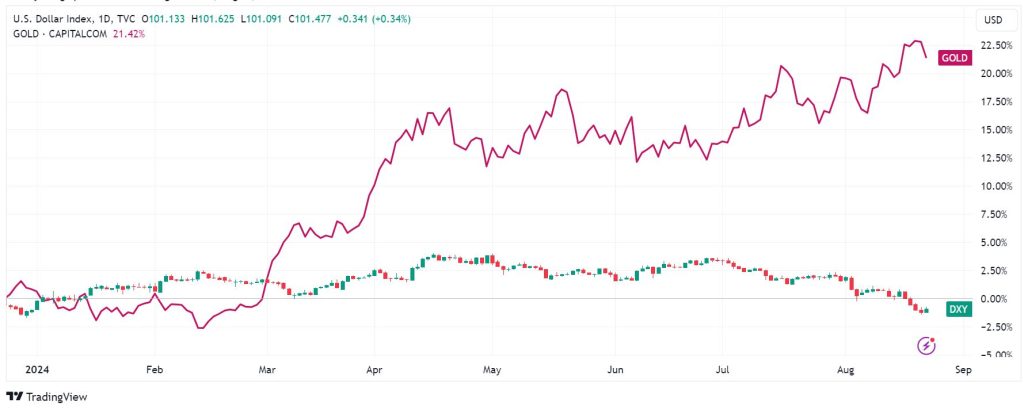
Gold Price Historical Chart
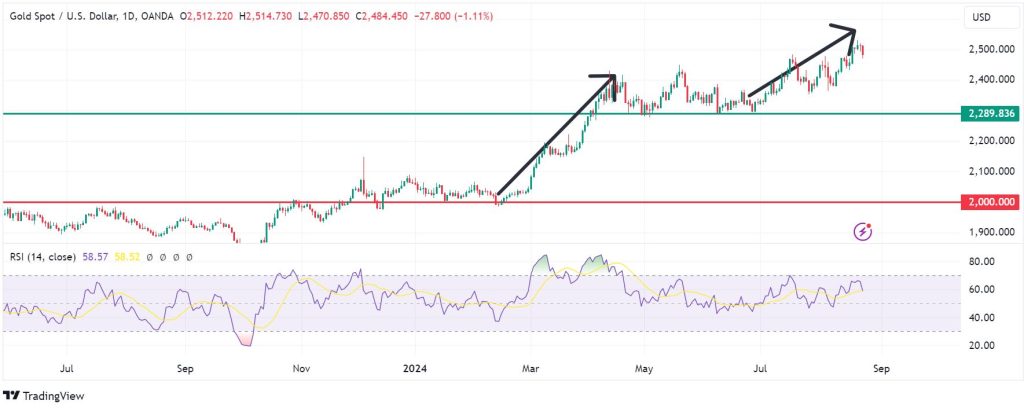
In August 2020, gold price rallied to an all-time high of $2,072.85, surpassing the previous record high of $1,924.77 it hit nine years before. With the subsequent decline, the psychologically crucial zone of $2,000 has remained evasive. However, it has remained above $1,600 since rising above it at the peak of the coronavirus pandemic in April 2020.
Gold price crashed to $1,616 on September 28, 2022. This price was about 21.88% from its highest point in 2022. This crash coincided with a period when the Federal Reserve was hiking interest rates aggressively in a bid to fight soaring inflation. It then started rising after signs emerged that inflation was starting to ease in the US.
Bullion has performed really well this year. The precious metal is up by 20.4 percent YTD, and at +3.6 percent in the last month . This has created a strong bullish undercurrent that could drive more gains in the second half of the year, especially in light of the impending Fed interest rate cuts. On the chart below, note the strong upside momentums above the $2,000 psychological level and the $2,289 marks. These could potentially serve as the near-term and medium-term support marks.
Gold Price Forecast & Latest Analysis
I accurately predicted that gold would hover around past the $2,300 mark in my previous forecasts.
As the price now seems to have gained strength above $2400, the pivot point will likely be at $2,502, while the immediate resistance could come at $2,525. Therefore, a break above that mark could strengthen bullishness. Furthermore, the commodity find initial support around 2,475. A break below that mark could signal bearishness. Safe haven buying is likely to be the biggest contributor to the bullish outlook, as geopolitical risk rises in the Middle East, but better-than-expected US economic data could limit the upside for gold.
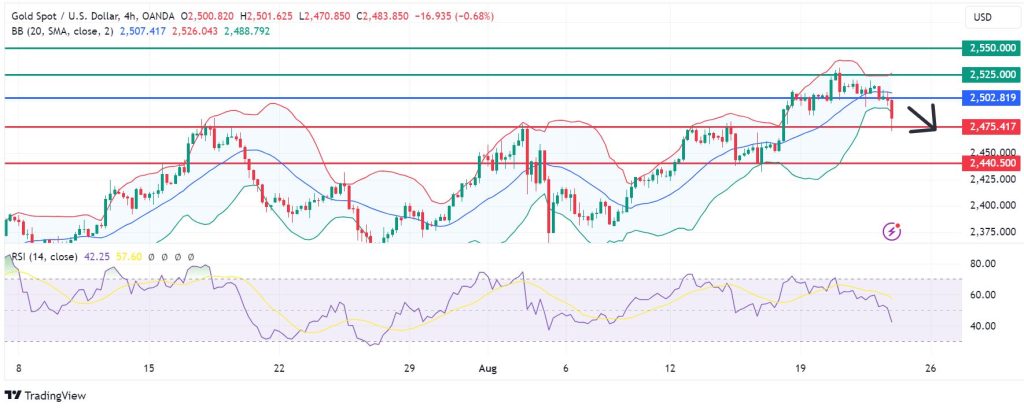
I’ll keep posting my updated outlook on Gold and other assets in my free Telegram group, which you’re welcome to join.
Gold Price Forecast 2025
The gold price forecast 2025 is largely an extrapolation of the influential factors in the current year. At the beginning of the year, Goldman Sachs indicated that the commodities bull market observed in the past year will likely continue into the current year and beyond. Indeed, the investment bank holds that the commodities supercycle will last for about 10 years.
The precious metal may reach new all-time highs above $2,200 an ounce based on this narrative. In addition, aIn addition, a tighter Fed policy and subsequent decline in economic growth will likely boost its performance as a risk-on asset.
However, even with the bullish gold price forecast 2025, competition from Bitcoin as a store of value may limit its upward potential.
Gold Price Forecast 2030
A feasible gold price forecast 2030 is founded on US dollar movements due to the existing inverse correlation. In the event of geopolitical tensions, gold may find some support in its status as a safe haven. However, its upward momentum may be limited by a rise in the demand for the greenback.
Over the past eight years, gold price has risen by about 60%. However, an assumption that the bull market will continue over the next eight years makes a surge of 50% viable. In that case, the gold price forecast for 2030 will be for the precious metal to hit a high of about $2,700 an ounce.
How to invest in gold
One of the viable ways to invest in gold is by buying bullion. It may be in coins or bars, certified with purity and weight have. Then, one can purchase or sell the physical gold to a reputable dealer. However, security reasons often lead some investors to embrace the route of futures and options.
Best gold stocks to invest in
One of the best ways to invest in gold is through stocks. In the past few years, mergers and acquisitions in the sector has led to a significant consolidation in the sector. Today, only a few large companies dominate the industry.
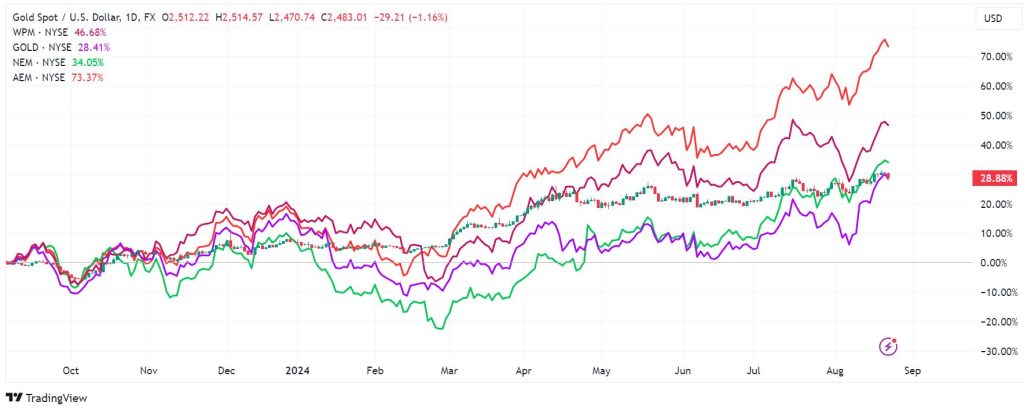
Barrick Gold, a company valued at $30 billion, is one of the best gold stocks to invest in. Its stock has dropped by about 7.95%. The other excellent stock to buy is Wheaton Precious Metals, which is worth over $17 billion. Unlike other gold companies, Wheaton does not do the real mining. Instead, the company has purchased rights for key gold assets.
The other best gold stocks to invest in are Newmont Corporation, and Agnico Eagle mine. The chart below shows the performance of some of the biggest gold stocks in the industry.
Gold futures
Futures are a contract in which one agrees to buy or sell the financial asset at the agreed-upon price before the expiry of the contract. For options, the investor has a chance and not an obligation to buy or sell the underlying instrument for as long as the contract is valid. To invest in gold via futures and options, one needs an account with a reputable financial broker. It is possible to trade in gold for a commission through the brokerage account.
Gold ETFs
ETFs and mutual funds are yet another viable way to invest in gold. A share of this financial instrument represents a specific amount of gold. One needs a brokerage account to trade in gold ETFs or mutual funds, like in futures and options.
In addition to the aforementioned ways of investing in gold, an investor can consider buying stocks of gold mining companies like Barrick Gold Corp. (GOLD) or Newmont Corp. (NEM). While the share price is usually correlated to gold price, the firm’s fundamentals are also influential.
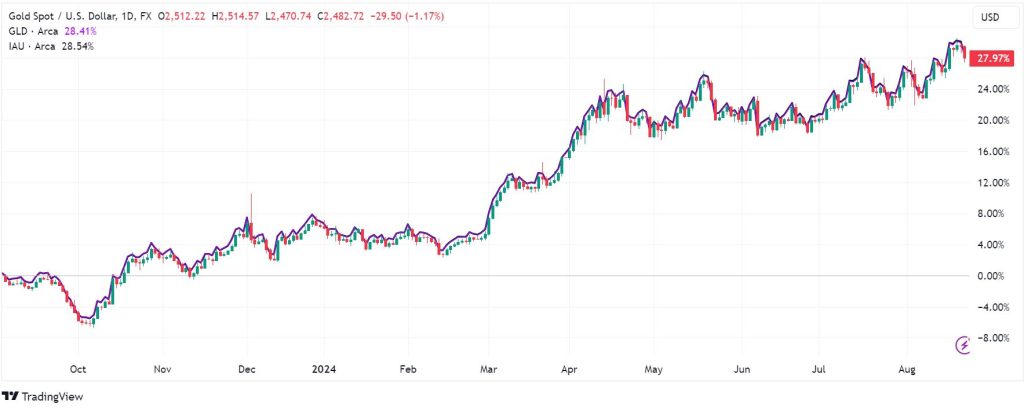
The chart below shows two of the most popular gold ETFs, the iShares Gold Trust and SPDR Gold Trust. As you can see, these ETF tend to move in sync with gold prices.
Summary
As was the case in 2021, gold’s relation with inflation has mixed. In 2024, the trend will likely continue as inflationary pressures continue to boost the precious metal. In addition, geopolitical tension in the Middle East and the Russia-Ukraine war will continue providing safe haven tailwinds. Furthermore, Fed interest rate decisions in Starting September will have a substantial impact on gold’s upward potential.


