- Summary:
- The Algorand price is corkscrewing in a tight descending triangle pattern, indicating the ALGO token will soon breakout in either direction.
The Algorand price is corkscrewing in a tight descending triangle pattern, indicating the ALGO token will soon breakout in either direction. Algorand (ALGO/USD) is currently trading at $1.785 (-0.32%), up +9.70% in October and 425% year-to-date. ALGO is currently valued at just under $10 billion and is the 20th-largest cryptocurrency behind Shiba Inu (SHIB/USD).
The Algorand Network witnessed a surge in investor interest in the third quarter. The ALGO token jumped 280% from the July lows to a 2021 high of $2.55 on the 10th of September. However, within a week, the Algorand price was 40% lower at $1.54 and failed to replicate the summer strength since. Like many altcoins, Algorand has been unable to follow Bitcoin higher recently. This morning, the market leader printed a new record price of $67,000 following the Proshares Bitcoin ETF (BITO) launch. A logical explanation could be that capital has rotated from altcoins into BTC to take advantage of the ETF launch. As a result, ALGO, like many of the mid-tier cryptos, is showing signs of exhaustion. However, depending on how the technicals play out over the next few days, a bullish scenario may emerge. On the other hand, so could a bearish one.
ALGO Price Forecast
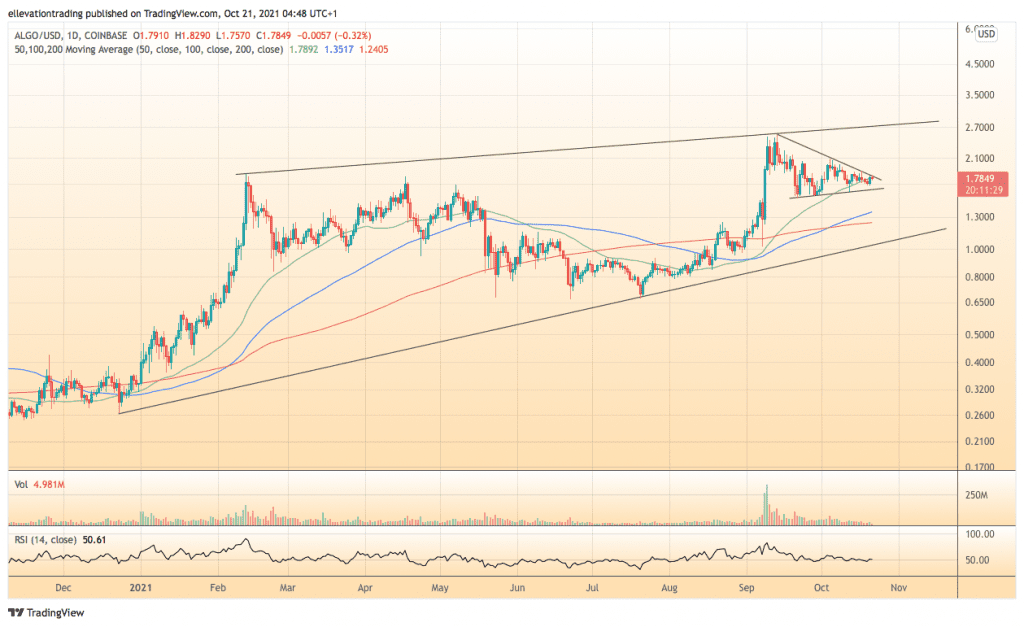
The daily chart shows the Algorand price is in a long term bull market. However, a descending triangle pattern has formed in the last month, which is typically considered bearish. The 50-day moving average joins the top edge of the triangle at $1.789 to create significant resistance. If ALGO manages to clear $1.789, I would consider it a bullish breakout, potentially targeting the September high at $2.55. The flip side of the argument is that if Algorand drops out of the triangle, it should extend lower.
The lower edge of the triangle at $1.612 is a significant support level. And on that basis, if the ALGO token slides below the trend line, I expect to see liquidation and momentum selling. In that event, the 100-day moving average at $1.351 and the 200-day at $1.240 become achievable targets. For now, there is no indication which scenario is more likely, and therefore, I hold a neutral view until the price breaches either trend line.
Algorand Price Chart (daily)

For more market insights, follow Elliott on Twitter.


