- Summary:
- Nvidia share price declined sharply on Tuesday, wiping out $279 billion, and raising questions about AI market. But there's a silver lining.
Nvidia stock (NASDAQ: NVDA) isn’t infallible, after all. The AI chipmaking giant went down by 9.5 percent on Tuesday, suffering a $279 billion loss and sending headwinds across other AI stocks and the wider stock market. That was the largest single-day loss by the company in 2024, ironically coming less than a week after reporting another forecast-beating quarterly earnings.
Despite its recent troubles, Nvidia share price is still up by 4 percent in the last month and has gained 119 percent year-to-date. However three loss-making days in the last five sessions point to potential overweight on the nascent AI chips market. Also, the drawdown by Nvidia on Tuesday comes despite having announced a $50 billion share buyback last week.
September has been historically a bad month for US stock markets, and this one seems likely to be no different. A blend of a highly-charged election rhetoric and soft economic data is certainly a potential recipe for reviving recession talk. The latest drawback came on Tuesday after the US ISM Manufacturing PMI and S&P Global Manufacturing PMI readings both missed market forecasts.
Despite the gloomy performance in recent days, Nvidia share price could rebound, as investors will have their eyes on the company’s superchip Blackwell GPUs, which will start shipping in the Q4 of 2024. Also, the company announced during its earnings call that shipments for its Hopper GPUs are expected to rise significantly in the H2 of FY 2025.
Nvidia share price today
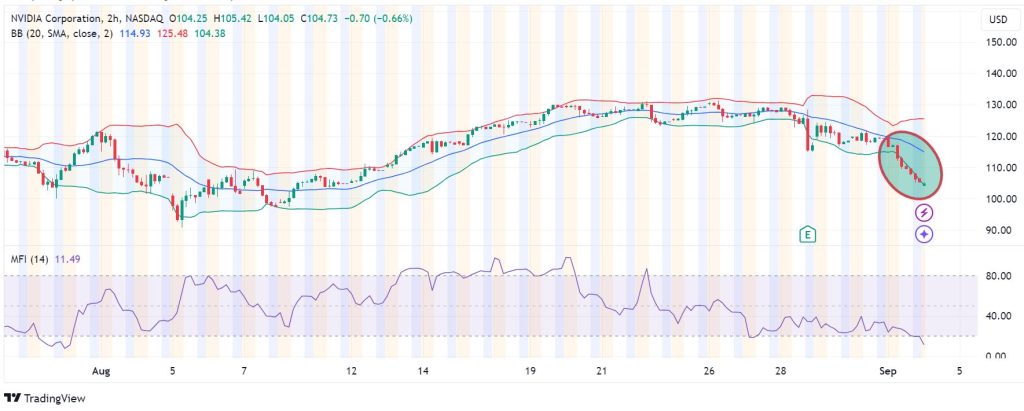
The momentum on Nvidia share price has waned, as seen on the 2-hour chart. The price has has been trending downward along the lower Bollinger Band, showing that the sellers are in control. Also, there has been a negative money flow from the stock, with the Money Flow Index reading at 11 signifying a higher selling than buying volume.
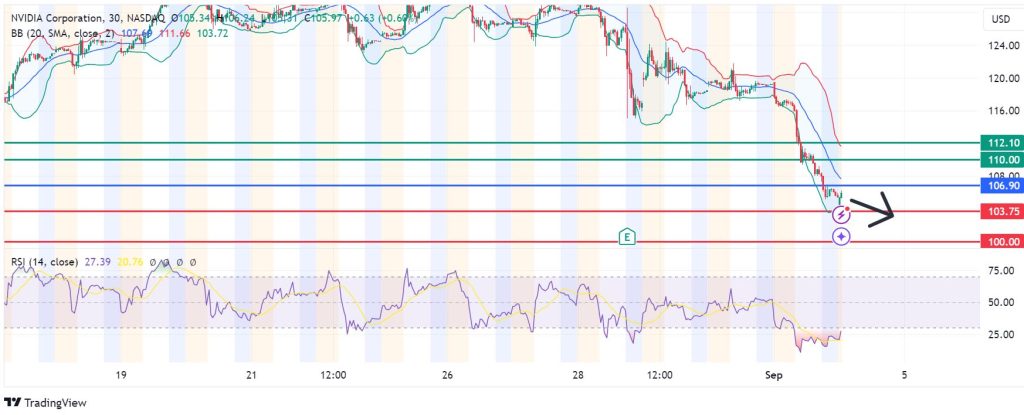
Meanwhile, the 30-minute chart calls for extension of the downside if resistance persists at 106.90. That will likely see the establishment of the first support at 103.75. However, if they extend their control, the sellers could generate enough momentum to breach that level and test 100.00.
Alternatively, moving above 106.90 will signal the onset of bullish control, with the first resistance likely to be at 110.00. However, extended control by the buyers could lead to further gains to break above the resistance, invalidate the downside narative and test 112.10.