- Summary:
- The USDJPY pair recovered from an eleven-week low in the intraday session, but the return to the upside could be disrupted by US PCE data.
The USDJPY currency pair traded flat in the New York session on Thursday, as the dollar fought back on following forecast-beating US GDP figures. Earlier in the day, the yen had touched an eleven-week high against the dollar on the back of rising prospects of 25 basis point cut by the Federal Reserve before September. While that possibility still remains, the yen’s upsurge seems likely to slow down for now.
Surprise US GDP figures boost the dollar
US economy grew by 2.8 percent in the second quarter of the year, beating the forecast figure of 2 percent. Furthermore, that was a substantial jump from the 1.4 percent growth rate reported in the first half. US equities markets reacted to the news with an uptick in performance, with the Dow Jones Industrial Average Index up by 0.5 percent and the Nasdaq 100 up by 0.4 percent. Both indices had recorded declines of more than 3 percent on Wednesday.
Attention now shifts to Friday’s release of the much-awaited US Personal Consumption Expenditure (PCE) figures, which are expected to inject new volatility into the USDJPY pair. The PCE is widely considered as the Fed’s favourite tool in assessing inflation trajectory, and its reading will influence Fed decision making on interest rate. Meanwhile, Japan will release its July Consumer Price Index (CPI) figures later on Thursday, and that could influence the USDJPY trajectory ahead of the PCE release.
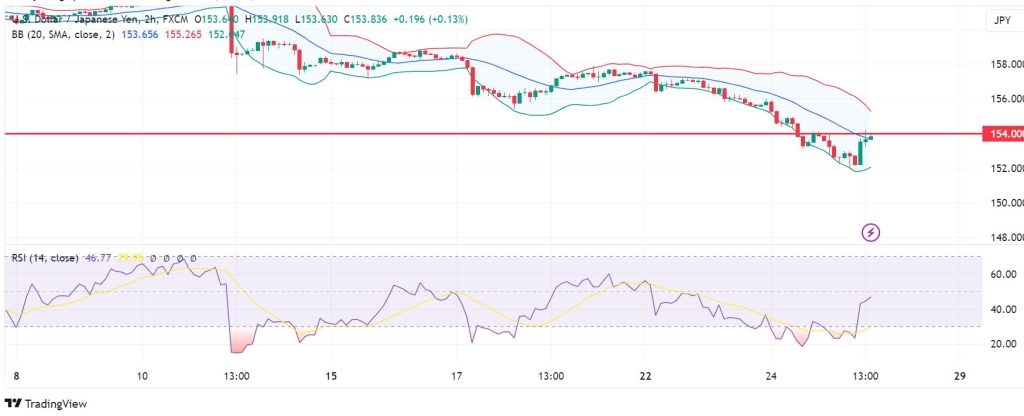
Momentum indicators
The momentum on the 2-hour USDJPY chart signals a push-and-pull between the buyers and the sellers. As per the Bollinger Bands Indicator, the price has recently crossed above the middle band, signaling that the buyers are in control. The intersection point aligns with 154.00, making it a key pivot level. On the other hand, the Relative Strength Index (RSI) is at 47, which is largely neutral. That said, the RSI is above the RSI-based MA line, signaling shifting control towards the buyers.
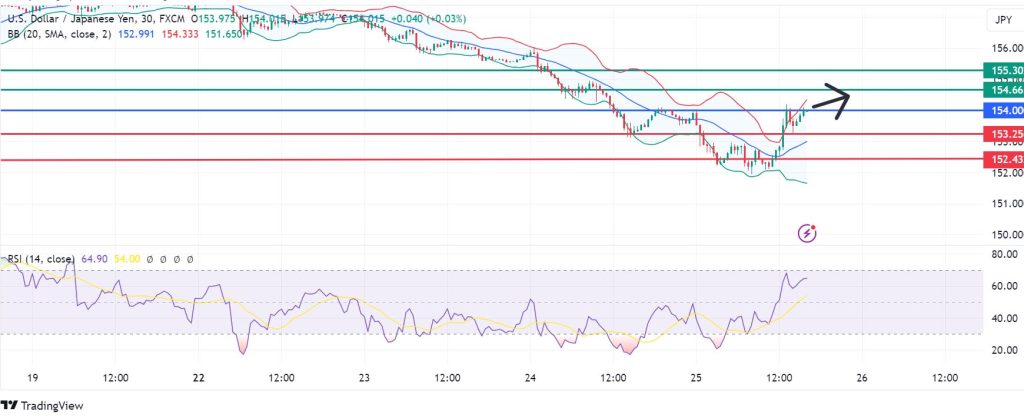
Support and resistance levels
On the 30-minute chart, the USDJPY pair looks set to continue the upside above 154.00. That could provide the momentum to push to the first resistance at 154.66, with further bullish control potentially breaking that barrier to test 155.30. On the other hand, a move below 154.00 will signal control by the sellers. The downward momentum will likely find initial support at 153.25, but further control by the sellers could breach that mark, invalidating the upside narrative and potentially strengthening the downside momentum to move to 152.43.